

374
H. J. Byrne et al.
by Raman spectroscopy has been carried out [108] and it was found that 1,3 gtg
cross linkages induce more distortion in the B-form dNA as compared to the 1,2gg complex.
Cancer cell lines, such as the A549 human lung adenocarcinoma cell line provide
a good in vitro model for lung cancer. the high spatial resolution of Raman microscopy can be employed to identify localized spectroscopic changes in the nucleus,
cytoplasm and cell membrane and the responses can be correlated with drug dose,
as well as physiological response, as determined by the cytotoxicological assay
mtt. Feature selection techniques can then be used to identify regions of the spectrum that are associated with the biochemical effect of exposure to the agent, and
with the subsequent cytotoxicological response of the cells.
the mtt assay is a measure of the mitochondrial metabolic activity and can
be used initially as a standard against which to map the spectroscopic response of
the cells. maximum cytotoxicity was observed after 96 h exposure and thus this
time period was employed for all measurements. the cytotoxicity induced in A549
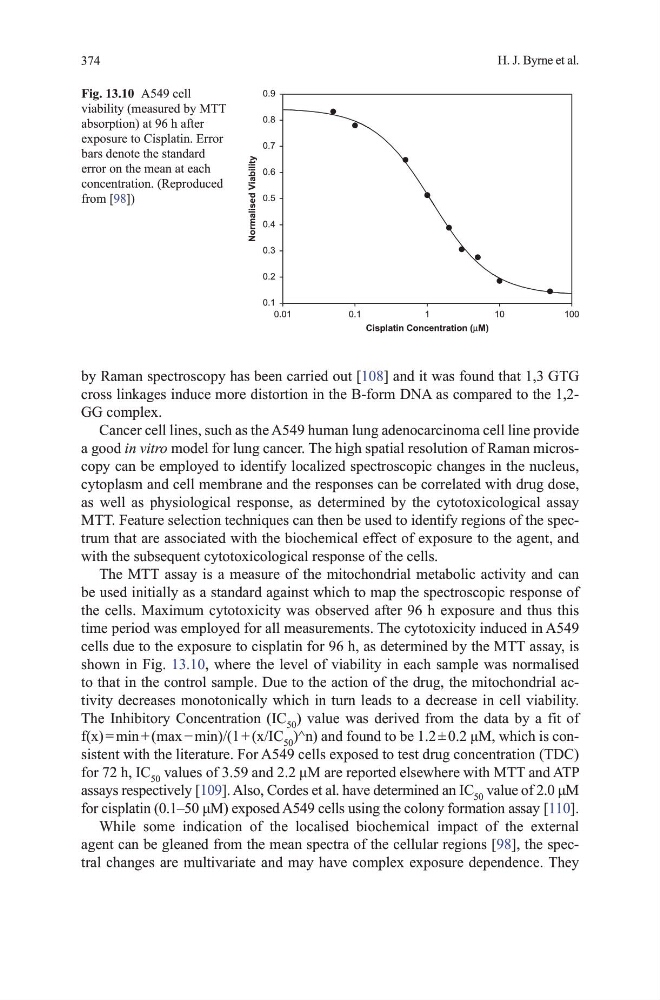
cells due to the exposure to cisplatin for 96 h, as determined by the mtt assay, is
shown in Fig. 13.10, where the level of viability in each sample was normalised
to that in the control sample. due to the action of the drug, the mitochondrial activity decreases monotonically which in turn leads to a decrease in cell viability.
the Inhibitory Concentration (IC 50 ) value was derived from the data by a fit of
f(x) = min + (max − min)/(1 + (x/IC 50 )^n) and found to be 1.2 ± 0.2 μM, which is consistent with the literature. For A549 cells exposed to test drug concentration (tdC)
for 72 h, IC 50 values of 3.59 and 2.2 μM are reported elsewhere with MTT and ATP
assays respectively [109]. Also, Cordes et al. have determined an IC 50 value of 2.0 μM
for cisplatin (0.1–50 μM) exposed A549 cells using the colony formation assay [110].
While some indication of the localised biochemical impact of the external
agent can be gleaned from the mean spectra of the cellular regions [98], the spectral changes are multivariate and may have complex exposure dependence. they
0.01
Normalised Viability
0.1
0.2
0.3
0.4
0.5
0.6
0.7
0.8
0.9
0.1
Cisplatin Concentration (µM)
1
10
100
Fig. 13.10 A549 cell
viability (measured by mtt
absorption) at 96 h after
exposure to Cisplatin. Error
bars denote the standard
error on the mean at each
concentration. (Reproduced
from [98])
H. J. Byrne et al.
by Raman spectroscopy has been carried out [108] and it was found that 1,3 gtg
cross linkages induce more distortion in the B-form dNA as compared to the 1,2gg complex.
Cancer cell lines, such as the A549 human lung adenocarcinoma cell line provide
a good in vitro model for lung cancer. the high spatial resolution of Raman microscopy can be employed to identify localized spectroscopic changes in the nucleus,
cytoplasm and cell membrane and the responses can be correlated with drug dose,
as well as physiological response, as determined by the cytotoxicological assay
mtt. Feature selection techniques can then be used to identify regions of the spectrum that are associated with the biochemical effect of exposure to the agent, and
with the subsequent cytotoxicological response of the cells.
the mtt assay is a measure of the mitochondrial metabolic activity and can
be used initially as a standard against which to map the spectroscopic response of
the cells. maximum cytotoxicity was observed after 96 h exposure and thus this
time period was employed for all measurements. the cytotoxicity induced in A549
cells due to the exposure to cisplatin for 96 h, as determined by the mtt assay, is
shown in Fig. 13.10, where the level of viability in each sample was normalised
to that in the control sample. due to the action of the drug, the mitochondrial activity decreases monotonically which in turn leads to a decrease in cell viability.
the Inhibitory Concentration (IC 50 ) value was derived from the data by a fit of
f(x) = min + (max − min)/(1 + (x/IC 50 )^n) and found to be 1.2 ± 0.2 μM, which is consistent with the literature. For A549 cells exposed to test drug concentration (tdC)
for 72 h, IC 50 values of 3.59 and 2.2 μM are reported elsewhere with MTT and ATP
assays respectively [109]. Also, Cordes et al. have determined an IC 50 value of 2.0 μM
for cisplatin (0.1–50 μM) exposed A549 cells using the colony formation assay [110].
While some indication of the localised biochemical impact of the external
agent can be gleaned from the mean spectra of the cellular regions [98], the spectral changes are multivariate and may have complex exposure dependence. they
0.01
Normalised Viability
0.1
0.2
0.3
0.4
0.5
0.6
0.7
0.8
0.9
0.1
Cisplatin Concentration (µM)
1
10
100
Fig. 13.10 A549 cell
viability (measured by mtt
absorption) at 96 h after
exposure to Cisplatin. Error
bars denote the standard
error on the mean at each
concentration. (Reproduced
from [98])