

372
H. J. Byrne et al.
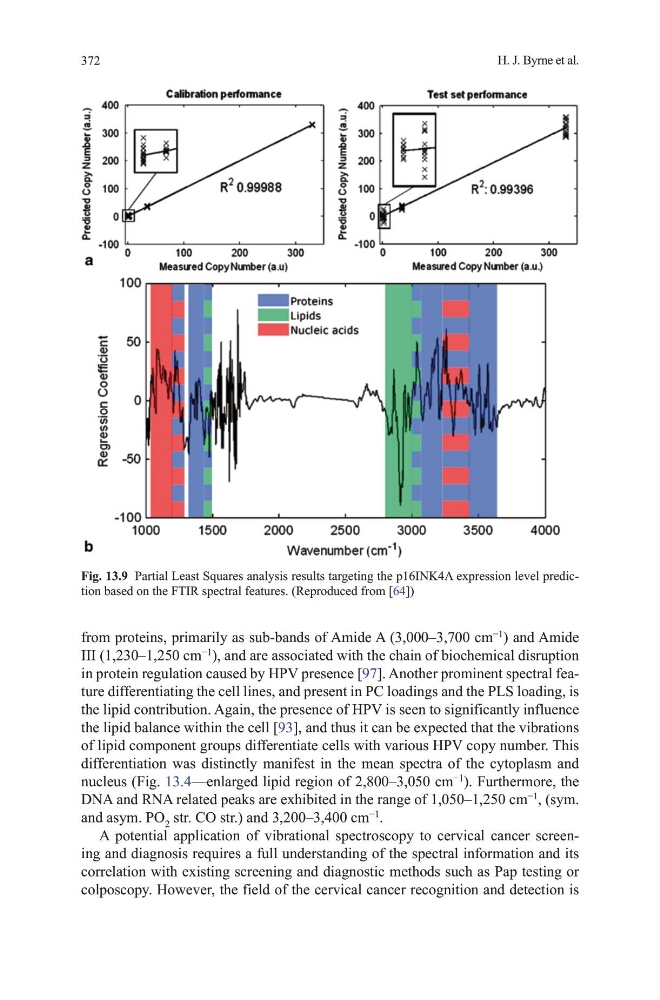
from proteins, primarily as sub-bands of Amide A (3,000–3,700 cm
−1
) and Amide
III (1,230–1,250 cm
−1
), and are associated with the chain of biochemical disruption
in protein regulation caused by hPv presence [97]. Another prominent spectral feature differentiating the cell lines, and present in PC loadings and the PLS loading, is
the lipid contribution. Again, the presence of hPv is seen to significantly influence
the lipid balance within the cell [93], and thus it can be expected that the vibrations
of lipid component groups differentiate cells with various hPv copy number. this
differentiation was distinctly manifest in the mean spectra of the cytoplasm and
nucleus (Fig. 13.4—enlarged lipid region of 2,800–3,050 cm
−1
). Furthermore, the
dNA and RNA related peaks are exhibited in the range of 1,050–1,250 cm
−1
, (sym.
and asym. Po 2 str. Co str.) and 3,200–3,400 cm
−1
.
A potential application of vibrational spectroscopy to cervical cancer screening and diagnosis requires a full understanding of the spectral information and its
correlation with existing screening and diagnostic methods such as Pap testing or
colposcopy. however, the field of the cervical cancer recognition and detection is
Fig. 13.9 Partial Least Squares analysis results targeting the p16INK4A expression level prediction based on the FtIR spectral features. (Reproduced from [64])
H. J. Byrne et al.
from proteins, primarily as sub-bands of Amide A (3,000–3,700 cm
−1
) and Amide
III (1,230–1,250 cm
−1
), and are associated with the chain of biochemical disruption
in protein regulation caused by hPv presence [97]. Another prominent spectral feature differentiating the cell lines, and present in PC loadings and the PLS loading, is
the lipid contribution. Again, the presence of hPv is seen to significantly influence
the lipid balance within the cell [93], and thus it can be expected that the vibrations
of lipid component groups differentiate cells with various hPv copy number. this
differentiation was distinctly manifest in the mean spectra of the cytoplasm and
nucleus (Fig. 13.4—enlarged lipid region of 2,800–3,050 cm
−1
). Furthermore, the
dNA and RNA related peaks are exhibited in the range of 1,050–1,250 cm
−1
, (sym.
and asym. Po 2 str. Co str.) and 3,200–3,400 cm
−1
.
A potential application of vibrational spectroscopy to cervical cancer screening and diagnosis requires a full understanding of the spectral information and its
correlation with existing screening and diagnostic methods such as Pap testing or
colposcopy. however, the field of the cervical cancer recognition and detection is
Fig. 13.9 Partial Least Squares analysis results targeting the p16INK4A expression level prediction based on the FtIR spectral features. (Reproduced from [64])