

359
13 Vibrational Spectroscopy: Disease Diagnostics and Beyond
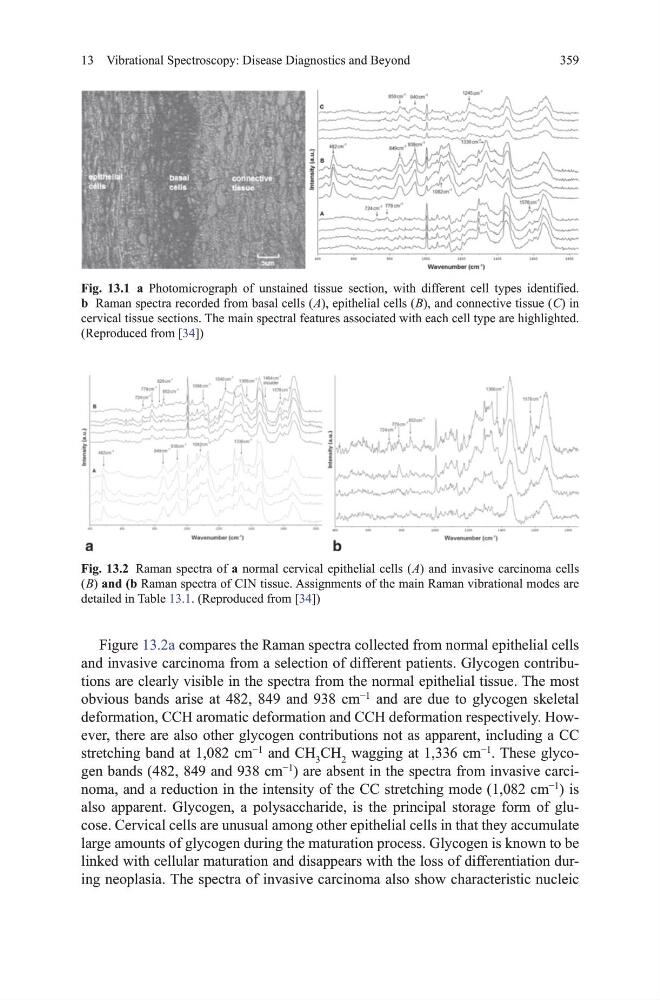
Figure 13.2a compares the Raman spectra collected from normal epithelial cells
and invasive carcinoma from a selection of different patients. glycogen contributions are clearly visible in the spectra from the normal epithelial tissue. the most
obvious bands arise at 482, 849 and 938 cm
−1
and are due to glycogen skeletal
deformation, CCh aromatic deformation and CCh deformation respectively. however, there are also other glycogen contributions not as apparent, including a CC
stretching band at 1,082 cm
−1
and Ch 3 Ch 2 wagging at 1,336 cm
−1
. these glycogen bands (482, 849 and 938 cm
−1
) are absent in the spectra from invasive carcinoma, and a reduction in the intensity of the CC stretching mode (1,082 cm
−1
) is
also apparent. glycogen, a polysaccharide, is the principal storage form of glucose. Cervical cells are unusual among other epithelial cells in that they accumulate
large amounts of glycogen during the maturation process. glycogen is known to be
linked with cellular maturation and disappears with the loss of differentiation during neoplasia. the spectra of invasive carcinoma also show characteristic nucleic
Fig. 13.2 Raman spectra of a normal cervical epithelial cells ( A) and invasive carcinoma cells
( B) and (b Raman spectra of CIN tissue. Assignments of the main Raman vibrational modes are
detailed in table 13.1. (Reproduced from [34])
Fig. 13.1 a Photomicrograph of unstained tissue section, with different cell types identified.
b Raman spectra recorded from basal cells ( A), epithelial cells ( B), and connective tissue ( C) in
cervical tissue sections. the main spectral features associated with each cell type are highlighted.
(Reproduced from [34])
13 Vibrational Spectroscopy: Disease Diagnostics and Beyond
Figure 13.2a compares the Raman spectra collected from normal epithelial cells
and invasive carcinoma from a selection of different patients. glycogen contributions are clearly visible in the spectra from the normal epithelial tissue. the most
obvious bands arise at 482, 849 and 938 cm
−1
and are due to glycogen skeletal
deformation, CCh aromatic deformation and CCh deformation respectively. however, there are also other glycogen contributions not as apparent, including a CC
stretching band at 1,082 cm
−1
and Ch 3 Ch 2 wagging at 1,336 cm
−1
. these glycogen bands (482, 849 and 938 cm
−1
) are absent in the spectra from invasive carcinoma, and a reduction in the intensity of the CC stretching mode (1,082 cm
−1
) is
also apparent. glycogen, a polysaccharide, is the principal storage form of glucose. Cervical cells are unusual among other epithelial cells in that they accumulate
large amounts of glycogen during the maturation process. glycogen is known to be
linked with cellular maturation and disappears with the loss of differentiation during neoplasia. the spectra of invasive carcinoma also show characteristic nucleic
Fig. 13.2 Raman spectra of a normal cervical epithelial cells ( A) and invasive carcinoma cells
( B) and (b Raman spectra of CIN tissue. Assignments of the main Raman vibrational modes are
detailed in table 13.1. (Reproduced from [34])
Fig. 13.1 a Photomicrograph of unstained tissue section, with different cell types identified.
b Raman spectra recorded from basal cells ( A), epithelial cells ( B), and connective tissue ( C) in
cervical tissue sections. the main spectral features associated with each cell type are highlighted.
(Reproduced from [34])