

350
2
2
2
2
2
1
|
|
|
|
R
w
M
w
R
w
M
w
L
i
k
i
L
i
k
i
i
1401
(12.2)
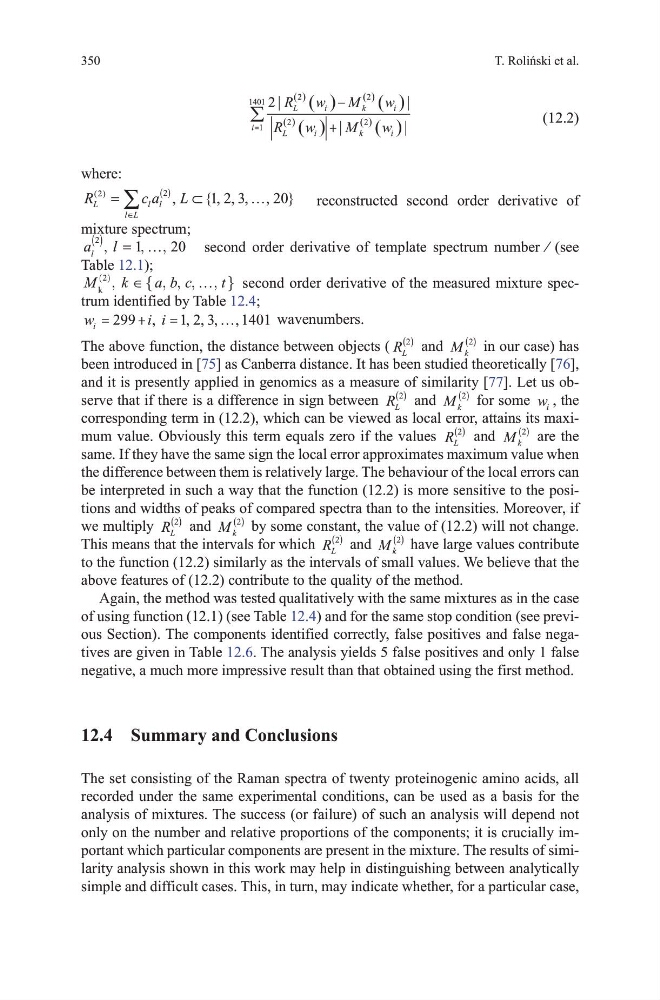
where:
R
ca L
L
l
l L
l
( )
,
{, , , , }
2
2
1 2 3
20
=
⊂
…
∈
( )
∑
reconstructed second order derivative of
mixture spectrum;
a l
l
2
1
20
( ) = …
,
, , second order derivative of template spectrum number ⁄ (see
table 12.1);
M
k
a b c
t
k
( )
, { , , , , }
2
second order derivative of the measured mixture spectrum identified by table 12.4;
w
i i
i
299
1 2 3
,
, , , , 1401 wavenumbers.
the above function, the distance between objects ( R L
2
( )
and M k
2
( )
in our case) has
been introduced in [75] as Canberra distance. It has been studied theoretically [76],
and it is presently applied in genomics as a measure of similarity [77]. Let us observe that if there is a difference in sign between R L
2
( )
and M k
2
( )
for some w i , the
corresponding term in (12.2), which can be viewed as local error, attains its maximum value. obviously this term equals zero if the values R L
2
( )
and M k
2
( )
are the
same. If they have the same sign the local error approximates maximum value when
the difference between them is relatively large. the behaviour of the local errors can
be interpreted in such a way that the function (12.2) is more sensitive to the positions and widths of peaks of compared spectra than to the intensities. moreover, if
we multiply R L
2
( )
and M k
2
( )
by some constant, the value of (12.2) will not change.
this means that the intervals for which R L
2
( )
and M k
2
( )
have large values contribute
to the function (12.2) similarly as the intervals of small values. We believe that the
above features of (12.2) contribute to the quality of the method.
Again, the method was tested qualitatively with the same mixtures as in the case
of using function (12.1) (see table 12.4) and for the same stop condition (see previous Section). the components identified correctly, false positives and false negatives are given in table 12.6. the analysis yields 5 false positives and only 1 false
negative, a much more impressive result than that obtained using the first method.
12.4 Summary and Conclusions
the set consisting of the Raman spectra of twenty proteinogenic amino acids, all
recorded under the same experimental conditions, can be used as a basis for the
analysis of mixtures. the success (or failure) of such an analysis will depend not
only on the number and relative proportions of the components; it is crucially important which particular components are present in the mixture. the results of similarity analysis shown in this work may help in distinguishing between analytically
simple and difficult cases. this, in turn, may indicate whether, for a particular case,
T. Roliński et al.
2
2
2
2
2
1
|
|
|
|
R
w
M
w
R
w
M
w
L
i
k
i
L
i
k
i
i
1401
(12.2)
where:
R
ca L
L
l
l L
l
( )
,
{, , , , }
2
2
1 2 3
20
=
⊂
…
∈
( )
∑
reconstructed second order derivative of
mixture spectrum;
a l
l
2
1
20
( ) = …
,
, , second order derivative of template spectrum number ⁄ (see
table 12.1);
M
k
a b c
t
k
( )
, { , , , , }
2
second order derivative of the measured mixture spectrum identified by table 12.4;
w
i i
i
299
1 2 3
,
, , , , 1401 wavenumbers.
the above function, the distance between objects ( R L
2
( )
and M k
2
( )
in our case) has
been introduced in [75] as Canberra distance. It has been studied theoretically [76],
and it is presently applied in genomics as a measure of similarity [77]. Let us observe that if there is a difference in sign between R L
2
( )
and M k
2
( )
for some w i , the
corresponding term in (12.2), which can be viewed as local error, attains its maximum value. obviously this term equals zero if the values R L
2
( )
and M k
2
( )
are the
same. If they have the same sign the local error approximates maximum value when
the difference between them is relatively large. the behaviour of the local errors can
be interpreted in such a way that the function (12.2) is more sensitive to the positions and widths of peaks of compared spectra than to the intensities. moreover, if
we multiply R L
2
( )
and M k
2
( )
by some constant, the value of (12.2) will not change.
this means that the intervals for which R L
2
( )
and M k
2
( )
have large values contribute
to the function (12.2) similarly as the intervals of small values. We believe that the
above features of (12.2) contribute to the quality of the method.
Again, the method was tested qualitatively with the same mixtures as in the case
of using function (12.1) (see table 12.4) and for the same stop condition (see previous Section). the components identified correctly, false positives and false negatives are given in table 12.6. the analysis yields 5 false positives and only 1 false
negative, a much more impressive result than that obtained using the first method.
12.4 Summary and Conclusions
the set consisting of the Raman spectra of twenty proteinogenic amino acids, all
recorded under the same experimental conditions, can be used as a basis for the
analysis of mixtures. the success (or failure) of such an analysis will depend not
only on the number and relative proportions of the components; it is crucially important which particular components are present in the mixture. the results of similarity analysis shown in this work may help in distinguishing between analytically
simple and difficult cases. this, in turn, may indicate whether, for a particular case,
T. Roliński et al.