

333
[3] contains the data for 18 amino acids. With respect to the data presented here,
cysteine, glutamine, and asparagine are missing. however, these data lack the low
frequency region, starting from values different for each amino acid, in the range
of 400–670 cm
−1
. the other paper, by Culka et al. [7], is focused on registering
the spectra outdoors, using two different portable Raman instruments. this study
is limited to 13 amino acids. Below we present a concise summary of the relevant
Raman spectra of solid amino acids registered so far, noting, for several cases, the
discrepancies between these spectra and our results.
Glycine many groups studied the Raman spectra of the simplest amino acid in the
solid phase [3, 7–14]. the spectra reported by various researchers are quite similar. the Raman spectrum of solid glycine presented in the most recent work [3]
practically coincides (within 2–3 cm
−1
) with our spectra. Also the relative intensity
patterns are comparable.
Alanine this molecule is amongst the most popular of all amino acids, and therefore numerous workers used Raman techniques in the investigation of the crystalline form, including pressure and temperature dependence of the spectra [3, 7,
15–27]. our spectrum nicely agrees with those recorded for both polycrystalline
and single crystal samples.
Arginine In contrast to alanine, literature data on arginine are rather scarce. the
Raman spectra of several salts have been reported [28–32]; they strongly differ
from a spectrum of solid arginine published by Zhu et al [3]. the latter strongly
resembles our spectrum.
12 Raman Spectra of Solid Aminoacids: Spectral Correlation Analysis …
Amino acid
Acronym
1
Arginine
Arg
2
Proline
Pro
3
Alanine
Ala
4
Phenylalanine
Phe
5
Cysteine
Cys
6
Asparagine
Asn
7
glutamine
gln
8
Leucine
Leu
9
threonine
thr
10
valine
val
11
Isoleucine
Ile
12
glutamic acid
glu
13
glycine
gly
14
Aspartic acid
Asp
15
Lysine
Lys
16
methionine
met
17
histidine
his
18
Serine
Ser
19
tryptophan
trp
20
tyrosine
tyr
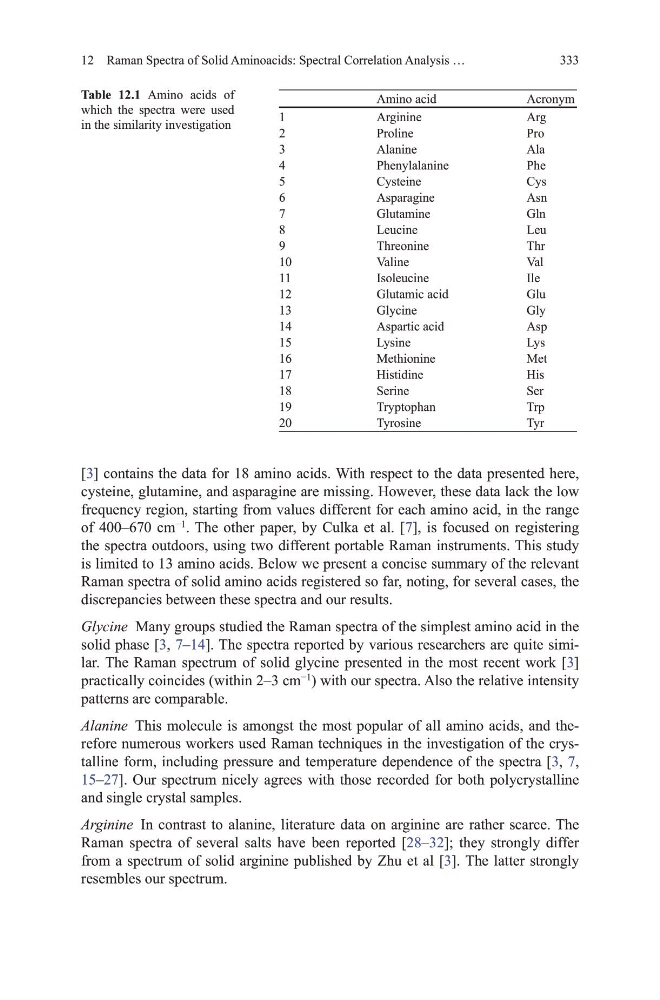
Table 12.1 Amino acids of
which the spectra were used
in the similarity investigation
[3] contains the data for 18 amino acids. With respect to the data presented here,
cysteine, glutamine, and asparagine are missing. however, these data lack the low
frequency region, starting from values different for each amino acid, in the range
of 400–670 cm
−1
. the other paper, by Culka et al. [7], is focused on registering
the spectra outdoors, using two different portable Raman instruments. this study
is limited to 13 amino acids. Below we present a concise summary of the relevant
Raman spectra of solid amino acids registered so far, noting, for several cases, the
discrepancies between these spectra and our results.
Glycine many groups studied the Raman spectra of the simplest amino acid in the
solid phase [3, 7–14]. the spectra reported by various researchers are quite similar. the Raman spectrum of solid glycine presented in the most recent work [3]
practically coincides (within 2–3 cm
−1
) with our spectra. Also the relative intensity
patterns are comparable.
Alanine this molecule is amongst the most popular of all amino acids, and therefore numerous workers used Raman techniques in the investigation of the crystalline form, including pressure and temperature dependence of the spectra [3, 7,
15–27]. our spectrum nicely agrees with those recorded for both polycrystalline
and single crystal samples.
Arginine In contrast to alanine, literature data on arginine are rather scarce. the
Raman spectra of several salts have been reported [28–32]; they strongly differ
from a spectrum of solid arginine published by Zhu et al [3]. the latter strongly
resembles our spectrum.
12 Raman Spectra of Solid Aminoacids: Spectral Correlation Analysis …
Amino acid
Acronym
1
Arginine
Arg
2
Proline
Pro
3
Alanine
Ala
4
Phenylalanine
Phe
5
Cysteine
Cys
6
Asparagine
Asn
7
glutamine
gln
8
Leucine
Leu
9
threonine
thr
10
valine
val
11
Isoleucine
Ile
12
glutamic acid
glu
13
glycine
gly
14
Aspartic acid
Asp
15
Lysine
Lys
16
methionine
met
17
histidine
his
18
Serine
Ser
19
tryptophan
trp
20
tyrosine
tyr
Table 12.1 Amino acids of
which the spectra were used
in the similarity investigation