

10 Chemometric Analysis of Raman and IR Spectra of Natural Dyes
299
mid-IR spectroscopy was successfully employed with the multivariate analysis
to determine quercetin in onion [94]. the results were compared with hPLC data
and the coefficient factors > 0.95 again proved the applicability of both methods.
two-dimensional correlation infrared transmission spectroscopy allowed the
analysis of deterioration of the traditional Chinese medicine, ‘Qing Kai Ling’, containing flavonoids [98]. According to the authors, in spite of the mid-IR spectra
of non-degradated and deteriorated medicine are almost undistinguishable, 2d-IR
analysis made this problem possible to solve. thanks to the perturbation applied
to the sample (here, contact with air), the analysis allowed to determine at which
positions, in such a measured signal, a systematic changes in spectra were observed.
then, the comparison of 2d correlation spectra of untreated and deteriorated medicine was performed.
In every case, the 2d correlation analysis results in two complementary signals,
which referred to the so called 2d synchronous and 2d asynchronous spectra [64].
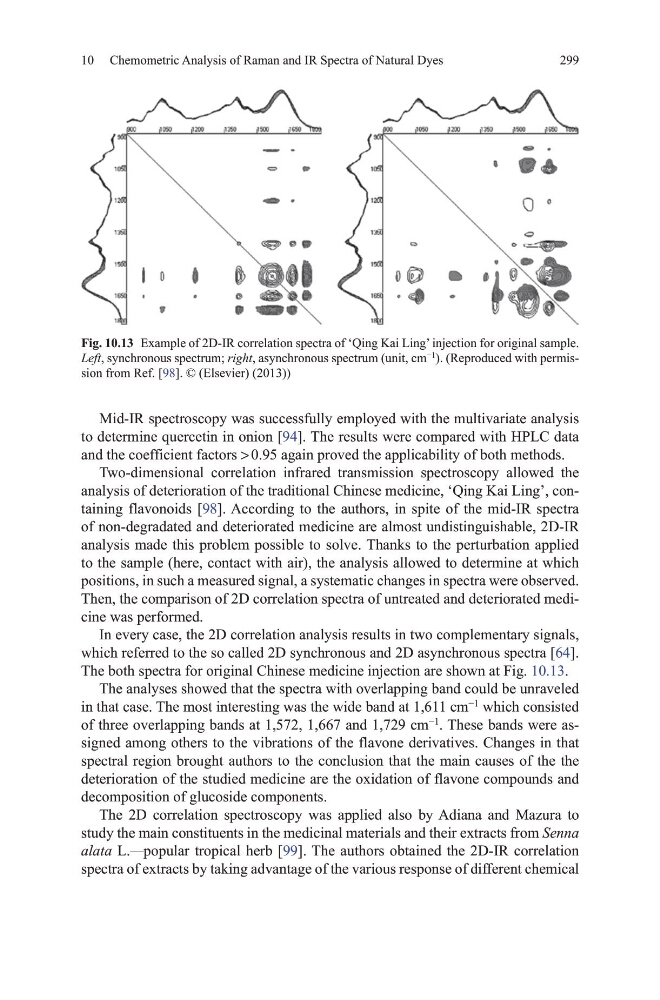
the both spectra for original Chinese medicine injection are shown at Fig. 10.13.
the analyses showed that the spectra with overlapping band could be unraveled
in that case. the most interesting was the wide band at 1,611 cm
−1
which consisted
of three overlapping bands at 1,572, 1,667 and 1,729 cm
−1
. these bands were assigned among others to the vibrations of the flavone derivatives. Changes in that
spectral region brought authors to the conclusion that the main causes of the the
deterioration of the studied medicine are the oxidation of flavone compounds and
decomposition of glucoside components.
the 2d correlation spectroscopy was applied also by Adiana and mazura to
study the main constituents in the medicinal materials and their extracts from Senna
alata L.—popular tropical herb [99]. the authors obtained the 2d-IR correlation
spectra of extracts by taking advantage of the various response of different chemical
Fig. 10.13 Example of 2d-IR correlation spectra of ‘Qing Kai Ling’ injection for original sample.
Left, synchronous spectrum; right, asynchronous spectrum (unit, cm
−1
). (Reproduced with permission from Ref. [98]. © (Elsevier) (2013))
299
mid-IR spectroscopy was successfully employed with the multivariate analysis
to determine quercetin in onion [94]. the results were compared with hPLC data
and the coefficient factors > 0.95 again proved the applicability of both methods.
two-dimensional correlation infrared transmission spectroscopy allowed the
analysis of deterioration of the traditional Chinese medicine, ‘Qing Kai Ling’, containing flavonoids [98]. According to the authors, in spite of the mid-IR spectra
of non-degradated and deteriorated medicine are almost undistinguishable, 2d-IR
analysis made this problem possible to solve. thanks to the perturbation applied
to the sample (here, contact with air), the analysis allowed to determine at which
positions, in such a measured signal, a systematic changes in spectra were observed.
then, the comparison of 2d correlation spectra of untreated and deteriorated medicine was performed.
In every case, the 2d correlation analysis results in two complementary signals,
which referred to the so called 2d synchronous and 2d asynchronous spectra [64].
the both spectra for original Chinese medicine injection are shown at Fig. 10.13.
the analyses showed that the spectra with overlapping band could be unraveled
in that case. the most interesting was the wide band at 1,611 cm
−1
which consisted
of three overlapping bands at 1,572, 1,667 and 1,729 cm
−1
. these bands were assigned among others to the vibrations of the flavone derivatives. Changes in that
spectral region brought authors to the conclusion that the main causes of the the
deterioration of the studied medicine are the oxidation of flavone compounds and
decomposition of glucoside components.
the 2d correlation spectroscopy was applied also by Adiana and mazura to
study the main constituents in the medicinal materials and their extracts from Senna
alata L.—popular tropical herb [99]. the authors obtained the 2d-IR correlation
spectra of extracts by taking advantage of the various response of different chemical
Fig. 10.13 Example of 2d-IR correlation spectra of ‘Qing Kai Ling’ injection for original sample.
Left, synchronous spectrum; right, asynchronous spectrum (unit, cm
−1
). (Reproduced with permission from Ref. [98]. © (Elsevier) (2013))