

A. Rygula and P. Miskowiec
290
on the other hand, it should be noted that in both Raman and IR studies of the
natural products (including dyes) the quantitative comparison with other, the so
called reference techniques is unavoidable. In such operation chemometrics is also
irreplaceable.
the most popular techniques used for quantitative analysis are classical least
square (CLS), multiple linear regression (mLR), partial least square (PLS) and principal components regression (PCR) [51, 65].
the PLS method applied in RS is so-called “full spectrum method” what means
that calibration model is improved with an increasing number of data points, in opposite to methods which require to choose the marker bands [66].
10.3 Raman and IR Analysis of Selected Dyes
In this chapter more details are provided for carotenoids, flavonoids, antrachinons
and indigo, in addition to information gathered to illustrate the qualitative and quantitative Ft-Raman analysis of plants (Chap. 9). moreover in this part of review Raman data are followed by IR and NIR results for these dyes.
10.3.1 Carotenoids
the Raman analysis of carotenoids is well documented [e.g. 11, 67]. Carotenoids
occur in plants as a secondary metabolites on the ppm level, however, due to high
sensitivity of the Resonance Raman spectroscopy (with the laser excitation from
the visible range), even such small amounts are possible to be detected [68, 69].
A strong enhancement can be also achieved by using Ft-Raman spectroscopy and
pre-resonance effect.
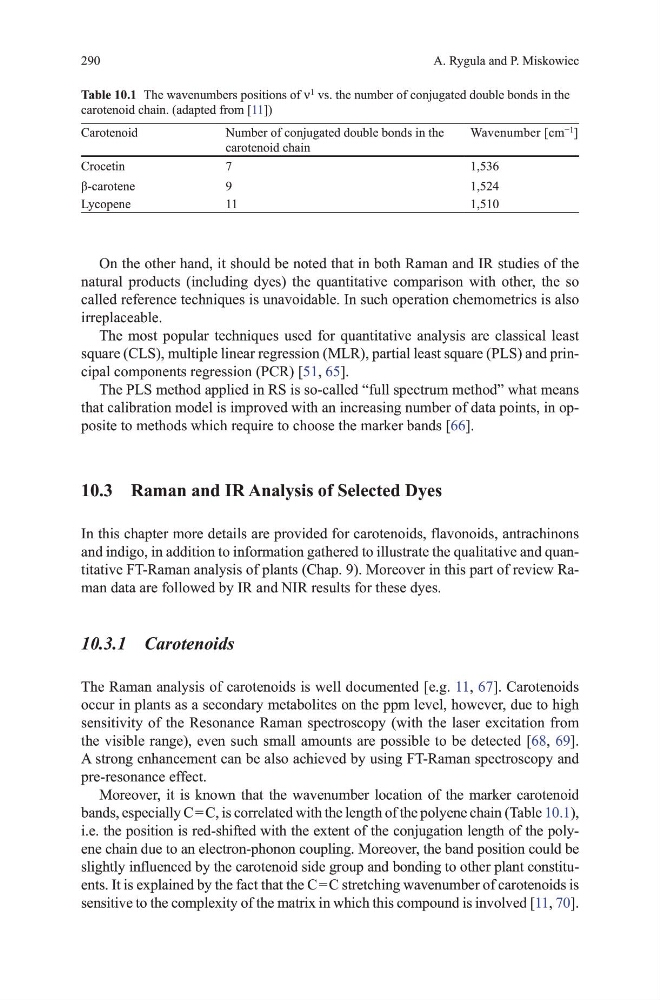
moreover, it is known that the wavenumber location of the marker carotenoid
bands, especially C = C, is correlated with the length of the polyene chain (table 10.1),
i.e. the position is red-shifted with the extent of the conjugation length of the polyene chain due to an electron-phonon coupling. moreover, the band position could be
slightly influenced by the carotenoid side group and bonding to other plant constituents. It is explained by the fact that the C = C stretching wavenumber of carotenoids is
sensitive to the complexity of the matrix in which this compound is involved [11, 70].
Carotenoid
Number of conjugated double bonds in the
carotenoid chain
Wavenumber [cm
−1
]
Crocetin
7
1,536
β-carotene
9
1,524
Lycopene
11
1,510
Table 10.1 the wavenumbers positions of ν
1
vs. the number of conjugated double bonds in the
carotenoid chain. (adapted from [11])
290
on the other hand, it should be noted that in both Raman and IR studies of the
natural products (including dyes) the quantitative comparison with other, the so
called reference techniques is unavoidable. In such operation chemometrics is also
irreplaceable.
the most popular techniques used for quantitative analysis are classical least
square (CLS), multiple linear regression (mLR), partial least square (PLS) and principal components regression (PCR) [51, 65].
the PLS method applied in RS is so-called “full spectrum method” what means
that calibration model is improved with an increasing number of data points, in opposite to methods which require to choose the marker bands [66].
10.3 Raman and IR Analysis of Selected Dyes
In this chapter more details are provided for carotenoids, flavonoids, antrachinons
and indigo, in addition to information gathered to illustrate the qualitative and quantitative Ft-Raman analysis of plants (Chap. 9). moreover in this part of review Raman data are followed by IR and NIR results for these dyes.
10.3.1 Carotenoids
the Raman analysis of carotenoids is well documented [e.g. 11, 67]. Carotenoids
occur in plants as a secondary metabolites on the ppm level, however, due to high
sensitivity of the Resonance Raman spectroscopy (with the laser excitation from
the visible range), even such small amounts are possible to be detected [68, 69].
A strong enhancement can be also achieved by using Ft-Raman spectroscopy and
pre-resonance effect.
moreover, it is known that the wavenumber location of the marker carotenoid
bands, especially C = C, is correlated with the length of the polyene chain (table 10.1),
i.e. the position is red-shifted with the extent of the conjugation length of the polyene chain due to an electron-phonon coupling. moreover, the band position could be
slightly influenced by the carotenoid side group and bonding to other plant constituents. It is explained by the fact that the C = C stretching wavenumber of carotenoids is
sensitive to the complexity of the matrix in which this compound is involved [11, 70].
Carotenoid
Number of conjugated double bonds in the
carotenoid chain
Wavenumber [cm
−1
]
Crocetin
7
1,536
β-carotene
9
1,524
Lycopene
11
1,510
Table 10.1 the wavenumbers positions of ν
1
vs. the number of conjugated double bonds in the
carotenoid chain. (adapted from [11])