

10 Chemometric Analysis of Raman and IR Spectra of Natural Dyes
285
Infrared spectroscopy can be also used for the analysis due to the fact that molecules absorb infrared light of specific frequencies. one can divide the IR range into:
near infrared (14,000–4,000 cm
−1
), mid infrared (4,000–400 cm
−1
) and far infrared
(400–10 cm
−1
). For dyes, the near and mid infrared spectroscopies have been exploited for decades [36, 37] in biology, chemistry, forensic science, cultural heritage
and many more. those methods owe the popularity mainly due to their rapidity of
the analysis and low consumption of chemicals.
In mid-infrared dye analysis the reflectance methods are principal. Amongst
them AtR (attenuated total reflection) technique is commonly used due to its capability to measure in situ and no need for sample preparation [38]. Apart from AtR,
a dRIFt technique (diffuse Reflectance Infrared Fourier transform Spectroscopy)
is exploited for qualitative analysis of some dyes [39, 40] even if the dye structure
is unknown. however, dRIFt technique is particularly useful in the investigations
of the powdered samples. that is why it is more under the subject of interests of
industry and conservation sciences than biology or medicine.
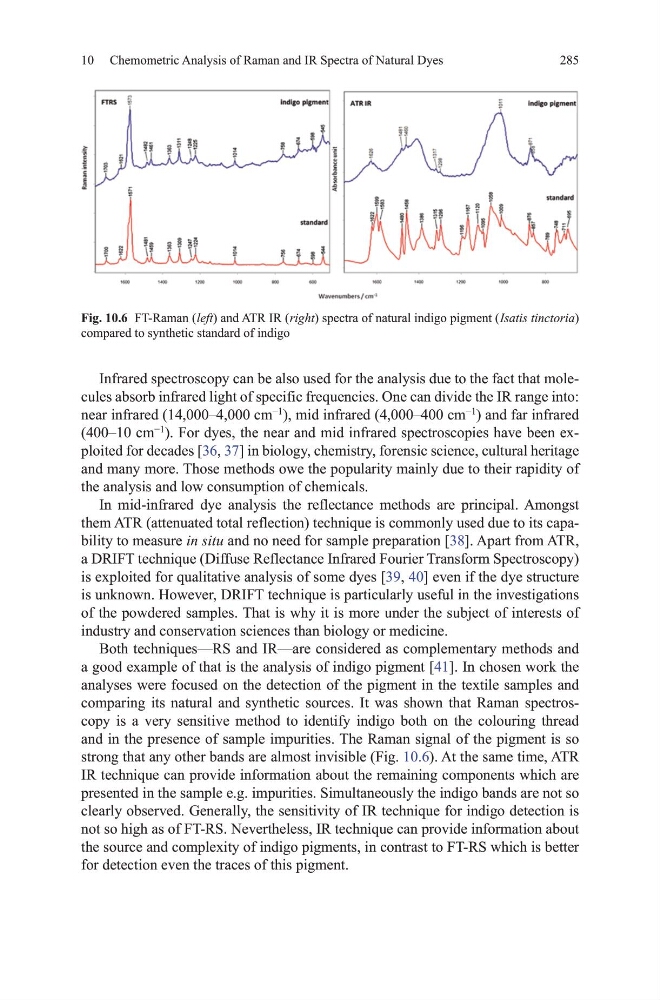
Both techniques—RS and IR—are considered as complementary methods and
a good example of that is the analysis of indigo pigment [41]. In chosen work the
analyses were focused on the detection of the pigment in the textile samples and
comparing its natural and synthetic sources. It was shown that Raman spectroscopy is a very sensitive method to identify indigo both on the colouring thread
and in the presence of sample impurities. the Raman signal of the pigment is so
strong that any other bands are almost invisible (Fig. 10.6). At the same time, AtR
IR technique can provide information about the remaining components which are
presented in the sample e.g. impurities. Simultaneously the indigo bands are not so
clearly observed. generally, the sensitivity of IR technique for indigo detection is
not so high as of Ft-RS. Nevertheless, IR technique can provide information about
the source and complexity of indigo pigments, in contrast to Ft-RS which is better
for detection even the traces of this pigment.
Fig. 10.6 Ft-Raman ( left) and AtR IR ( right) spectra of natural indigo pigment ( Isatis tinctoria)
compared to synthetic standard of indigo
285
Infrared spectroscopy can be also used for the analysis due to the fact that molecules absorb infrared light of specific frequencies. one can divide the IR range into:
near infrared (14,000–4,000 cm
−1
), mid infrared (4,000–400 cm
−1
) and far infrared
(400–10 cm
−1
). For dyes, the near and mid infrared spectroscopies have been exploited for decades [36, 37] in biology, chemistry, forensic science, cultural heritage
and many more. those methods owe the popularity mainly due to their rapidity of
the analysis and low consumption of chemicals.
In mid-infrared dye analysis the reflectance methods are principal. Amongst
them AtR (attenuated total reflection) technique is commonly used due to its capability to measure in situ and no need for sample preparation [38]. Apart from AtR,
a dRIFt technique (diffuse Reflectance Infrared Fourier transform Spectroscopy)
is exploited for qualitative analysis of some dyes [39, 40] even if the dye structure
is unknown. however, dRIFt technique is particularly useful in the investigations
of the powdered samples. that is why it is more under the subject of interests of
industry and conservation sciences than biology or medicine.
Both techniques—RS and IR—are considered as complementary methods and
a good example of that is the analysis of indigo pigment [41]. In chosen work the
analyses were focused on the detection of the pigment in the textile samples and
comparing its natural and synthetic sources. It was shown that Raman spectroscopy is a very sensitive method to identify indigo both on the colouring thread
and in the presence of sample impurities. the Raman signal of the pigment is so
strong that any other bands are almost invisible (Fig. 10.6). At the same time, AtR
IR technique can provide information about the remaining components which are
presented in the sample e.g. impurities. Simultaneously the indigo bands are not so
clearly observed. generally, the sensitivity of IR technique for indigo detection is
not so high as of Ft-RS. Nevertheless, IR technique can provide information about
the source and complexity of indigo pigments, in contrast to Ft-RS which is better
for detection even the traces of this pigment.
Fig. 10.6 Ft-Raman ( left) and AtR IR ( right) spectra of natural indigo pigment ( Isatis tinctoria)
compared to synthetic standard of indigo