

266
H. Schulz
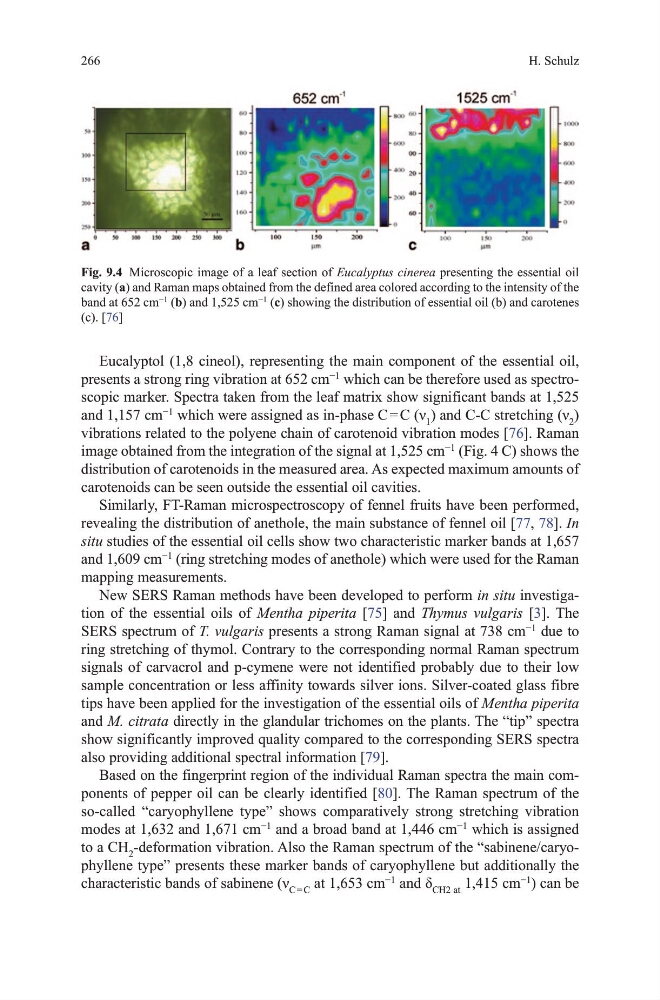
Eucalyptol (1,8 cineol), representing the main component of the essential oil,
presents a strong ring vibration at 652 cm
−1
which can be therefore used as spectroscopic marker. Spectra taken from the leaf matrix show significant bands at 1,525
and 1,157 cm
−1
which were assigned as in-phase C = C (ν 1 ) and C-C stretching (ν 2 )
vibrations related to the polyene chain of carotenoid vibration modes [76]. Raman
image obtained from the integration of the signal at 1,525 cm
−1
(Fig. 4 C) shows the
distribution of carotenoids in the measured area. As expected maximum amounts of
carotenoids can be seen outside the essential oil cavities.
Similarly, Ft-Raman microspectroscopy of fennel fruits have been performed,
revealing the distribution of anethole, the main substance of fennel oil [77, 78]. In
situ studies of the essential oil cells show two characteristic marker bands at 1,657
and 1,609 cm
−1
(ring stretching modes of anethole) which were used for the Raman
mapping measurements.
New SERS Raman methods have been developed to perform in situ investigation of the essential oils of Mentha piperita [75] and Thymus vulgaris [3]. the
SERS spectrum of T. vulgaris presents a strong Raman signal at 738 cm
−1
due to
ring stretching of thymol. Contrary to the corresponding normal Raman spectrum
signals of carvacrol and p-cymene were not identified probably due to their low
sample concentration or less affinity towards silver ions. Silver-coated glass fibre
tips have been applied for the investigation of the essential oils of Mentha piperita
and M. citrata directly in the glandular trichomes on the plants. the “tip” spectra
show significantly improved quality compared to the corresponding SERS spectra
also providing additional spectral information [79].
Based on the fingerprint region of the individual Raman spectra the main components of pepper oil can be clearly identified [80]. the Raman spectrum of the
so-called “caryophyllene type” shows comparatively strong stretching vibration
modes at 1,632 and 1,671 cm
−1
and a broad band at 1,446 cm
−1
which is assigned
to a Ch 2 -deformation vibration. Also the Raman spectrum of the “sabinene/caryophyllene type” presents these marker bands of caryophyllene but additionally the
characteristic bands of sabinene (ν C = C at 1,653 cm
−1
and δ Ch2 at 1,415 cm
−1
) can be
Fig. 9.4 microscopic image of a leaf section of Eucalyptus cinerea presenting the essential oil
cavity (a) and Raman maps obtained from the defined area colored according to the intensity of the
band at 652 cm
−1
(b) and 1,525 cm
−1
(c) showing the distribution of essential oil (b) and carotenes
(c). [76]
H. Schulz
Eucalyptol (1,8 cineol), representing the main component of the essential oil,
presents a strong ring vibration at 652 cm
−1
which can be therefore used as spectroscopic marker. Spectra taken from the leaf matrix show significant bands at 1,525
and 1,157 cm
−1
which were assigned as in-phase C = C (ν 1 ) and C-C stretching (ν 2 )
vibrations related to the polyene chain of carotenoid vibration modes [76]. Raman
image obtained from the integration of the signal at 1,525 cm
−1
(Fig. 4 C) shows the
distribution of carotenoids in the measured area. As expected maximum amounts of
carotenoids can be seen outside the essential oil cavities.
Similarly, Ft-Raman microspectroscopy of fennel fruits have been performed,
revealing the distribution of anethole, the main substance of fennel oil [77, 78]. In
situ studies of the essential oil cells show two characteristic marker bands at 1,657
and 1,609 cm
−1
(ring stretching modes of anethole) which were used for the Raman
mapping measurements.
New SERS Raman methods have been developed to perform in situ investigation of the essential oils of Mentha piperita [75] and Thymus vulgaris [3]. the
SERS spectrum of T. vulgaris presents a strong Raman signal at 738 cm
−1
due to
ring stretching of thymol. Contrary to the corresponding normal Raman spectrum
signals of carvacrol and p-cymene were not identified probably due to their low
sample concentration or less affinity towards silver ions. Silver-coated glass fibre
tips have been applied for the investigation of the essential oils of Mentha piperita
and M. citrata directly in the glandular trichomes on the plants. the “tip” spectra
show significantly improved quality compared to the corresponding SERS spectra
also providing additional spectral information [79].
Based on the fingerprint region of the individual Raman spectra the main components of pepper oil can be clearly identified [80]. the Raman spectrum of the
so-called “caryophyllene type” shows comparatively strong stretching vibration
modes at 1,632 and 1,671 cm
−1
and a broad band at 1,446 cm
−1
which is assigned
to a Ch 2 -deformation vibration. Also the Raman spectrum of the “sabinene/caryophyllene type” presents these marker bands of caryophyllene but additionally the
characteristic bands of sabinene (ν C = C at 1,653 cm
−1
and δ Ch2 at 1,415 cm
−1
) can be
Fig. 9.4 microscopic image of a leaf section of Eucalyptus cinerea presenting the essential oil
cavity (a) and Raman maps obtained from the defined area colored according to the intensity of the
band at 652 cm
−1
(b) and 1,525 cm
−1
(c) showing the distribution of essential oil (b) and carotenes
(c). [76]