

261
9 Qualitative and Quantitative FT-Raman Analysis of Plants
Furthermore, the absence of anthocyanin-metal chelates in presence of citric acid
could be confirmed.
Ft-Raman in situ measurements of aspalathin, a dihydrochalcone occurring in
leaves and stems of unfermented rooibos ( Aspalathus linearis) has been also performed [54]. Rooibos is indigenous to South Africa and increasingly of interest for
the industry due to its nutraceutical properties [55]. the authors demonstrated for
the first time that Ft-Raman spectroscopy is useful for the identification of aspalathin in dried, green rooibos and the development of a Raman based quantification
of aspalathin, nothofagin and total dihydrochalcone levels. Additionally, the advantage of two-dimensional (2d) correlation algorithms for reliable band assignment and an improved Raman quality analysis is presented. In this context a set of
rooibos samples with known, increasing concentration of aspalathin was selected,
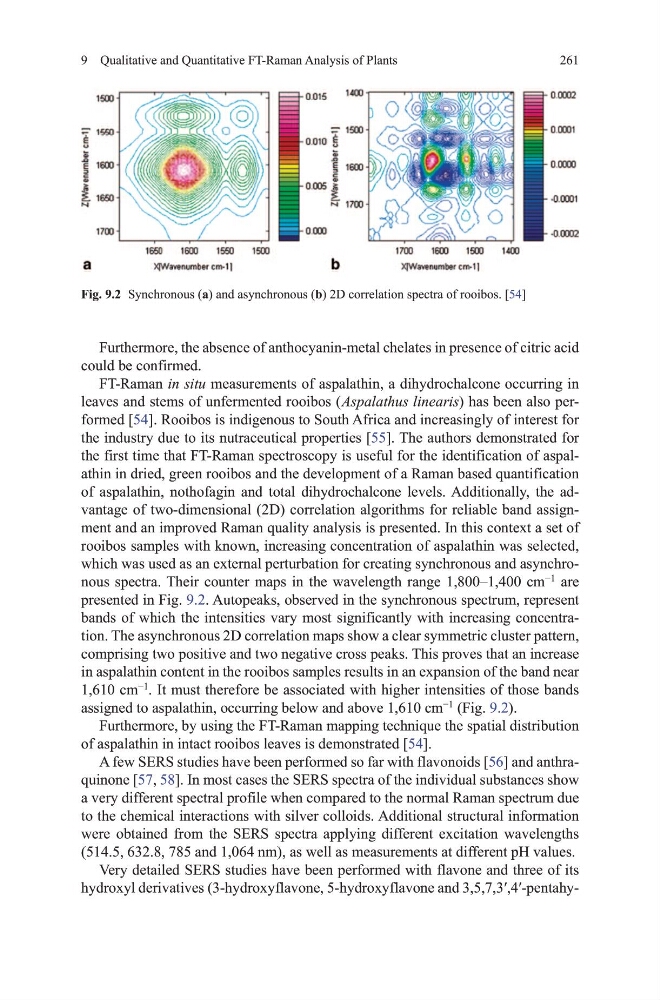
which was used as an external perturbation for creating synchronous and asynchronous spectra. their counter maps in the wavelength range 1,800–1,400 cm
−1
are
presented in Fig. 9.2. Autopeaks, observed in the synchronous spectrum, represent
bands of which the intensities vary most significantly with increasing concentration. the asynchronous 2d correlation maps show a clear symmetric cluster pattern,
comprising two positive and two negative cross peaks. this proves that an increase
in aspalathin content in the rooibos samples results in an expansion of the band near
1,610 cm
−1
. It must therefore be associated with higher intensities of those bands
assigned to aspalathin, occurring below and above 1,610 cm
−1
(Fig. 9.2).
Furthermore, by using the Ft-Raman mapping technique the spatial distribution
of aspalathin in intact rooibos leaves is demonstrated [54].
A few SERS studies have been performed so far with flavonoids [56] and anthraquinone [57, 58]. In most cases the SERS spectra of the individual substances show
a very different spectral profile when compared to the normal Raman spectrum due
to the chemical interactions with silver colloids. Additional structural information
were obtained from the SERS spectra applying different excitation wavelengths
(514.5, 632.8, 785 and 1,064 nm), as well as measurements at different ph values.
very detailed SERS studies have been performed with flavone and three of its
hydroxyl derivatives (3-hydroxyflavone, 5-hydroxyflavone and 3,5,7,3′,4′-pentahyFig. 9.2 Synchronous (a) and asynchronous (b) 2d correlation spectra of rooibos. [54]
9 Qualitative and Quantitative FT-Raman Analysis of Plants
Furthermore, the absence of anthocyanin-metal chelates in presence of citric acid
could be confirmed.
Ft-Raman in situ measurements of aspalathin, a dihydrochalcone occurring in
leaves and stems of unfermented rooibos ( Aspalathus linearis) has been also performed [54]. Rooibos is indigenous to South Africa and increasingly of interest for
the industry due to its nutraceutical properties [55]. the authors demonstrated for
the first time that Ft-Raman spectroscopy is useful for the identification of aspalathin in dried, green rooibos and the development of a Raman based quantification
of aspalathin, nothofagin and total dihydrochalcone levels. Additionally, the advantage of two-dimensional (2d) correlation algorithms for reliable band assignment and an improved Raman quality analysis is presented. In this context a set of
rooibos samples with known, increasing concentration of aspalathin was selected,
which was used as an external perturbation for creating synchronous and asynchronous spectra. their counter maps in the wavelength range 1,800–1,400 cm
−1
are
presented in Fig. 9.2. Autopeaks, observed in the synchronous spectrum, represent
bands of which the intensities vary most significantly with increasing concentration. the asynchronous 2d correlation maps show a clear symmetric cluster pattern,
comprising two positive and two negative cross peaks. this proves that an increase
in aspalathin content in the rooibos samples results in an expansion of the band near
1,610 cm
−1
. It must therefore be associated with higher intensities of those bands
assigned to aspalathin, occurring below and above 1,610 cm
−1
(Fig. 9.2).
Furthermore, by using the Ft-Raman mapping technique the spatial distribution
of aspalathin in intact rooibos leaves is demonstrated [54].
A few SERS studies have been performed so far with flavonoids [56] and anthraquinone [57, 58]. In most cases the SERS spectra of the individual substances show
a very different spectral profile when compared to the normal Raman spectrum due
to the chemical interactions with silver colloids. Additional structural information
were obtained from the SERS spectra applying different excitation wavelengths
(514.5, 632.8, 785 and 1,064 nm), as well as measurements at different ph values.
very detailed SERS studies have been performed with flavone and three of its
hydroxyl derivatives (3-hydroxyflavone, 5-hydroxyflavone and 3,5,7,3′,4′-pentahyFig. 9.2 Synchronous (a) and asynchronous (b) 2d correlation spectra of rooibos. [54]