

257
9 Qualitative and Quantitative FT-Raman Analysis of Plants
9.2.2 Proteins
Numerous studies have been performed to obtain Raman data of plant proteins and
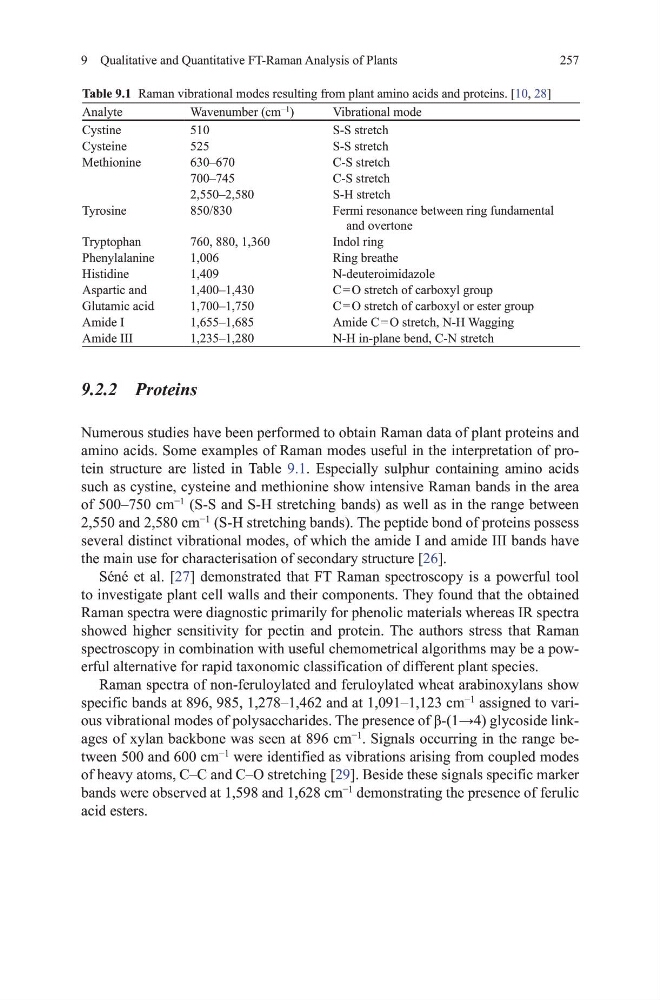
amino acids. Some examples of Raman modes useful in the interpretation of protein structure are listed in table 9.1. Especially sulphur containing amino acids
such as cystine, cysteine and methionine show intensive Raman bands in the area
of 500–750 cm
−1
(S-S and S-h stretching bands) as well as in the range between
2,550 and 2,580 cm
−1
(S-h stretching bands). the peptide bond of proteins possess
several distinct vibrational modes, of which the amide I and amide III bands have
the main use for characterisation of secondary structure [26].
Séné et al. [27] demonstrated that Ft Raman spectroscopy is a powerful tool
to investigate plant cell walls and their components. they found that the obtained
Raman spectra were diagnostic primarily for phenolic materials whereas IR spectra
showed higher sensitivity for pectin and protein. the authors stress that Raman
spectroscopy in combination with useful chemometrical algorithms may be a powerful alternative for rapid taxonomic classification of different plant species.
Raman spectra of non-feruloylated and feruloylated wheat arabinoxylans show
specific bands at 896, 985, 1,278–1,462 and at 1,091–1,123 cm
−1
ous vibrational modes of polysaccharides. The presence of β-(1→4) glycoside linkages of xylan backbone was seen at 896 cm
−1
. Signals occurring in the range between 500 and 600 cm
−1
were identified as vibrations arising from coupled modes
of heavy atoms, C–C and C–o stretching [29]. Beside these signals specific marker
bands were observed at 1,598 and 1,628 cm
−1
demonstrating the presence of ferulic
acid esters.
Table 9.1 Raman vibrational modes resulting from plant amino acids and proteins. [10, 28]
Analyte
Wavenumber (cm
−1
)
vibrational mode
Cystine
510
S-S stretch
Cysteine
525
S-S stretch
methionine
630–670
C-S stretch
700–745
C-S stretch
2,550–2,580
S-h stretch
tyrosine
850/830
Fermi resonance between ring fundamental
and overtone
tryptophan
760, 880, 1,360
Indol ring
Phenylalanine
1,006
Ring breathe
histidine
1,409
N-deuteroimidazole
Aspartic and
1,400–1,430
C = o stretch of carboxyl group
glutamic acid
1,700–1,750
C = o stretch of carboxyl or ester group
Amide I
1,655–1,685
Amide C = o stretch, N-h Wagging
Amide III
1,235–1,280
N-h in-plane bend, C-N stretch
9 Qualitative and Quantitative FT-Raman Analysis of Plants
9.2.2 Proteins
Numerous studies have been performed to obtain Raman data of plant proteins and
amino acids. Some examples of Raman modes useful in the interpretation of protein structure are listed in table 9.1. Especially sulphur containing amino acids
such as cystine, cysteine and methionine show intensive Raman bands in the area
of 500–750 cm
−1
(S-S and S-h stretching bands) as well as in the range between
2,550 and 2,580 cm
−1
(S-h stretching bands). the peptide bond of proteins possess
several distinct vibrational modes, of which the amide I and amide III bands have
the main use for characterisation of secondary structure [26].
Séné et al. [27] demonstrated that Ft Raman spectroscopy is a powerful tool
to investigate plant cell walls and their components. they found that the obtained
Raman spectra were diagnostic primarily for phenolic materials whereas IR spectra
showed higher sensitivity for pectin and protein. the authors stress that Raman
spectroscopy in combination with useful chemometrical algorithms may be a powerful alternative for rapid taxonomic classification of different plant species.
Raman spectra of non-feruloylated and feruloylated wheat arabinoxylans show
specific bands at 896, 985, 1,278–1,462 and at 1,091–1,123 cm
−1
ous vibrational modes of polysaccharides. The presence of β-(1→4) glycoside linkages of xylan backbone was seen at 896 cm
−1
. Signals occurring in the range between 500 and 600 cm
−1
were identified as vibrations arising from coupled modes
of heavy atoms, C–C and C–o stretching [29]. Beside these signals specific marker
bands were observed at 1,598 and 1,628 cm
−1
demonstrating the presence of ferulic
acid esters.
Table 9.1 Raman vibrational modes resulting from plant amino acids and proteins. [10, 28]
Analyte
Wavenumber (cm
−1
)
vibrational mode
Cystine
510
S-S stretch
Cysteine
525
S-S stretch
methionine
630–670
C-S stretch
700–745
C-S stretch
2,550–2,580
S-h stretch
tyrosine
850/830
Fermi resonance between ring fundamental
and overtone
tryptophan
760, 880, 1,360
Indol ring
Phenylalanine
1,006
Ring breathe
histidine
1,409
N-deuteroimidazole
Aspartic and
1,400–1,430
C = o stretch of carboxyl group
glutamic acid
1,700–1,750
C = o stretch of carboxyl or ester group
Amide I
1,655–1,685
Amide C = o stretch, N-h Wagging
Amide III
1,235–1,280
N-h in-plane bend, C-N stretch