

239
8 Two-Dimensional Mid-Infrared Correlation Spectroscopy in Protein Research
very difficult task to build a model that is well-matched to the experiment. A priori
information about the studied protein system in a form of the relative values of k eff
or β e for all the experimentally detectable structural components of this protein
could considerably facilitate the model-building procedure.
The βν-correlation procedure has found an excellent application in monitoring
the ordering behavior of phospholipid molecules in bilayers [139, 140] and structural changes in proteins incorporated into an ordered medium. the secondary structure of two small hydrophobic proteins (pulmonary surfactant protein SP-B and SPC) fused into phospholipid bilayers perturbed by increasing surface pressure was
analyzed by βν-correlation [58] and kν-correlation [68]. The Ψ(β,ν) spectrum of the
protein showed the presence of two α-helix components—a hydrophobic fraction
associated with the lipid chains and a hydrophilic fraction parallel to the membrane
surface. The distribution of the Ψ(β,ν) intensity between the two α-helix cross peaks
indicated that at low surface pressures, the more hydrophobic helix fraction dominated, whereas the more hydrophilic helix fraction dominated at high surface pressures. 2D kν-correlation analysis has proven that if the studied protein is transferred
0.9
0.7
0.5
0.3
0.1
1
1660
Absorbance
wavenumber (cm -1 )
ν 1, wavenumber (cm -1 )
ν 1, wavenumber (cm -1 )
ν
2, wavenumber (cm -1
)
1640
1620
1600
1
0.8
2 - rate constant of
the exponential runs
0.6
0.4
0.2
2
4
6
8
10
t
3
2
Asynchronous ( ν) spectrum
Asynchronous (νν) spectrum
5
4
3
2
1
0 1660
1640 1620
1600
1660
1660
1640
1640
1620
1620
1600
1600
0.08
0.04
-0.04
0
-0.08
eff -
eff +
eff -
exp(
2 t+R)
a
b
c
d
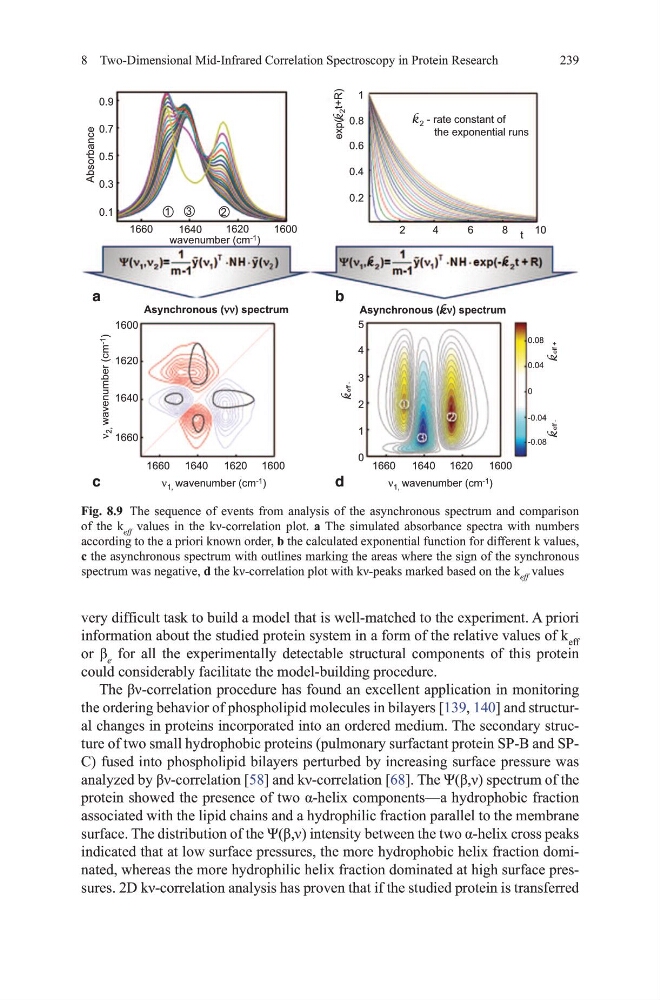
Fig. 8.9 the sequence of events from analysis of the asynchronous spectrum and comparison
of the k eff values in the kν-correlation plot. a the simulated absorbance spectra with numbers
according to the a priori known order, b the calculated exponential function for different k values,
c the asynchronous spectrum with outlines marking the areas where the sign of the synchronous
spectrum was negative, d the kν-correlation plot with kν-peaks marked based on the k eff values
8 Two-Dimensional Mid-Infrared Correlation Spectroscopy in Protein Research
very difficult task to build a model that is well-matched to the experiment. A priori
information about the studied protein system in a form of the relative values of k eff
or β e for all the experimentally detectable structural components of this protein
could considerably facilitate the model-building procedure.
The βν-correlation procedure has found an excellent application in monitoring
the ordering behavior of phospholipid molecules in bilayers [139, 140] and structural changes in proteins incorporated into an ordered medium. the secondary structure of two small hydrophobic proteins (pulmonary surfactant protein SP-B and SPC) fused into phospholipid bilayers perturbed by increasing surface pressure was
analyzed by βν-correlation [58] and kν-correlation [68]. The Ψ(β,ν) spectrum of the
protein showed the presence of two α-helix components—a hydrophobic fraction
associated with the lipid chains and a hydrophilic fraction parallel to the membrane
surface. The distribution of the Ψ(β,ν) intensity between the two α-helix cross peaks
indicated that at low surface pressures, the more hydrophobic helix fraction dominated, whereas the more hydrophilic helix fraction dominated at high surface pressures. 2D kν-correlation analysis has proven that if the studied protein is transferred
0.9
0.7
0.5
0.3
0.1
1
1660
Absorbance
wavenumber (cm -1 )
ν 1, wavenumber (cm -1 )
ν 1, wavenumber (cm -1 )
ν
2, wavenumber (cm -1
)
1640
1620
1600
1
0.8
2 - rate constant of
the exponential runs
0.6
0.4
0.2
2
4
6
8
10
t
3
2
Asynchronous ( ν) spectrum
Asynchronous (νν) spectrum
5
4
3
2
1
0 1660
1640 1620
1600
1660
1660
1640
1640
1620
1620
1600
1600
0.08
0.04
-0.04
0
-0.08
eff -
eff +
eff -
exp(
2 t+R)
a
b
c
d
Fig. 8.9 the sequence of events from analysis of the asynchronous spectrum and comparison
of the k eff values in the kν-correlation plot. a the simulated absorbance spectra with numbers
according to the a priori known order, b the calculated exponential function for different k values,
c the asynchronous spectrum with outlines marking the areas where the sign of the synchronous
spectrum was negative, d the kν-correlation plot with kν-peaks marked based on the k eff values