

237
8 Two-Dimensional Mid-Infrared Correlation Spectroscopy in Protein Research
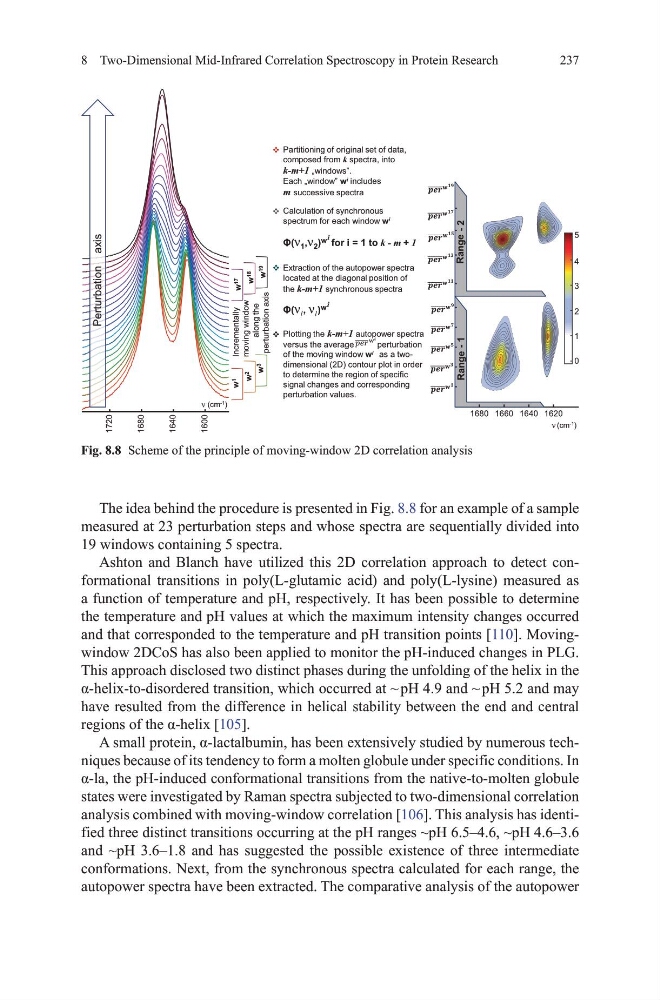
the idea behind the procedure is presented in Fig. 8.8 for an example of a sample
measured at 23 perturbation steps and whose spectra are sequentially divided into
19 windows containing 5 spectra.
Ashton and Blanch have utilized this 2d correlation approach to detect conformational transitions in poly(L-glutamic acid) and poly(L-lysine) measured as
a function of temperature and ph, respectively. It has been possible to determine
the temperature and ph values at which the maximum intensity changes occurred
and that corresponded to the temperature and ph transition points [110]. movingwindow 2dCoS has also been applied to monitor the ph-induced changes in PLg.
this approach disclosed two distinct phases during the unfolding of the helix in the
α-helix-to-disordered transition, which occurred at ~ pH 4.9 and ~ pH 5.2 and may
have resulted from the difference in helical stability between the end and central
regions of the α-helix [105].
A small protein, α-lactalbumin, has been extensively studied by numerous techniques because of its tendency to form a molten globule under specific conditions. In
α-la, the pH-induced conformational transitions from the native-to-molten globule
states were investigated by Raman spectra subjected to two-dimensional correlation
analysis combined with moving-window correlation [106]. this analysis has identified three distinct transitions occurring at the ph ranges ~ph 6.5–4.6, ~ph 4.6–3.6
and ~ph 3.6–1.8 and has suggested the possible existence of three intermediate
conformations. Next, from the synchronous spectra calculated for each range, the
autopower spectra have been extracted. the comparative analysis of the autopower
Incrementally
moving window
along the
perturbation axis
w 1
w 2
w 3
w 17
w 18
w 19
(cm -1 )
(cm -1 )
Perturbation axis
Range
- 2
Calculation of synchronous
spectrum for each window w i
Extraction of the autopower spectra
located at the diagonal position of
the k-m+1
Φ(ν 1 ,ν 2 ) w i for i = 1 to k - m + 1
Φ(ν l , ν l ) w i
synchronous spectra
Partitioning of original set of data,
composed from k spectra, into
k-m+1 „windows”.
Each „window” w i includes
m successive spectra
Plotting the k-m+1 autopower spectra
versus the average
perturbation
of the moving window w i as a twodimensional (2D) contour plot in order
to determine the region of specific
signal changes and corresponding
perturbation values.
1720
1680
1640
1600
1680 1660 1640 1620
0
1
2
3
4
5
Range - 1
ν
ν
Fig. 8.8 Scheme of the principle of moving-window 2d correlation analysis
8 Two-Dimensional Mid-Infrared Correlation Spectroscopy in Protein Research
the idea behind the procedure is presented in Fig. 8.8 for an example of a sample
measured at 23 perturbation steps and whose spectra are sequentially divided into
19 windows containing 5 spectra.
Ashton and Blanch have utilized this 2d correlation approach to detect conformational transitions in poly(L-glutamic acid) and poly(L-lysine) measured as
a function of temperature and ph, respectively. It has been possible to determine
the temperature and ph values at which the maximum intensity changes occurred
and that corresponded to the temperature and ph transition points [110]. movingwindow 2dCoS has also been applied to monitor the ph-induced changes in PLg.
this approach disclosed two distinct phases during the unfolding of the helix in the
α-helix-to-disordered transition, which occurred at ~ pH 4.9 and ~ pH 5.2 and may
have resulted from the difference in helical stability between the end and central
regions of the α-helix [105].
A small protein, α-lactalbumin, has been extensively studied by numerous techniques because of its tendency to form a molten globule under specific conditions. In
α-la, the pH-induced conformational transitions from the native-to-molten globule
states were investigated by Raman spectra subjected to two-dimensional correlation
analysis combined with moving-window correlation [106]. this analysis has identified three distinct transitions occurring at the ph ranges ~ph 6.5–4.6, ~ph 4.6–3.6
and ~ph 3.6–1.8 and has suggested the possible existence of three intermediate
conformations. Next, from the synchronous spectra calculated for each range, the
autopower spectra have been extracted. the comparative analysis of the autopower
Incrementally
moving window
along the
perturbation axis
w 1
w 2
w 3
w 17
w 18
w 19
(cm -1 )
(cm -1 )
Perturbation axis
Range
- 2
Calculation of synchronous
spectrum for each window w i
Extraction of the autopower spectra
located at the diagonal position of
the k-m+1
Φ(ν 1 ,ν 2 ) w i for i = 1 to k - m + 1
Φ(ν l , ν l ) w i
synchronous spectra
Partitioning of original set of data,
composed from k spectra, into
k-m+1 „windows”.
Each „window” w i includes
m successive spectra
Plotting the k-m+1 autopower spectra
versus the average
perturbation
of the moving window w i as a twodimensional (2D) contour plot in order
to determine the region of specific
signal changes and corresponding
perturbation values.
1720
1680
1640
1600
1680 1660 1640 1620
0
1
2
3
4
5
Range - 1
ν
ν
Fig. 8.8 Scheme of the principle of moving-window 2d correlation analysis