

172
M. Pecul and W. Dzwolak
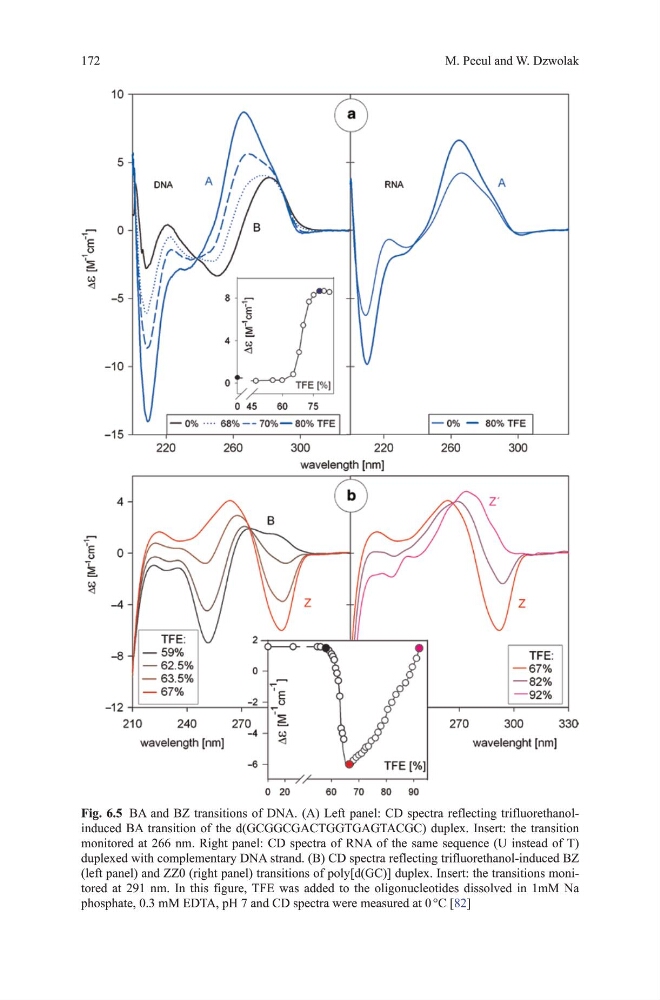
Fig. 6.5 BA and BZ transitions of dNA. (A) Left panel: Cd spectra reflecting trifluorethanolinduced BA transition of the d(gCggCgACtggtgAgtACgC) duplex. Insert: the transition
monitored at 266 nm. Right panel: Cd spectra of RNA of the same sequence (u instead of t)
duplexed with complementary dNA strand. (B) Cd spectra reflecting trifluorethanol-induced BZ
(left panel) and ZZ0 (right panel) transitions of poly[d(gC)] duplex. Insert: the transitions monitored at 291 nm. In this figure, tFE was added to the oligonucleotides dissolved in 1mm Na
phosphate, 0.3 mm EdtA, ph 7 and Cd spectra were measured at 0 °C [82]
M. Pecul and W. Dzwolak
Fig. 6.5 BA and BZ transitions of dNA. (A) Left panel: Cd spectra reflecting trifluorethanolinduced BA transition of the d(gCggCgACtggtgAgtACgC) duplex. Insert: the transition
monitored at 266 nm. Right panel: Cd spectra of RNA of the same sequence (u instead of t)
duplexed with complementary dNA strand. (B) Cd spectra reflecting trifluorethanol-induced BZ
(left panel) and ZZ0 (right panel) transitions of poly[d(gC)] duplex. Insert: the transitions monitored at 291 nm. In this figure, tFE was added to the oligonucleotides dissolved in 1mm Na
phosphate, 0.3 mm EdtA, ph 7 and Cd spectra were measured at 0 °C [82]