

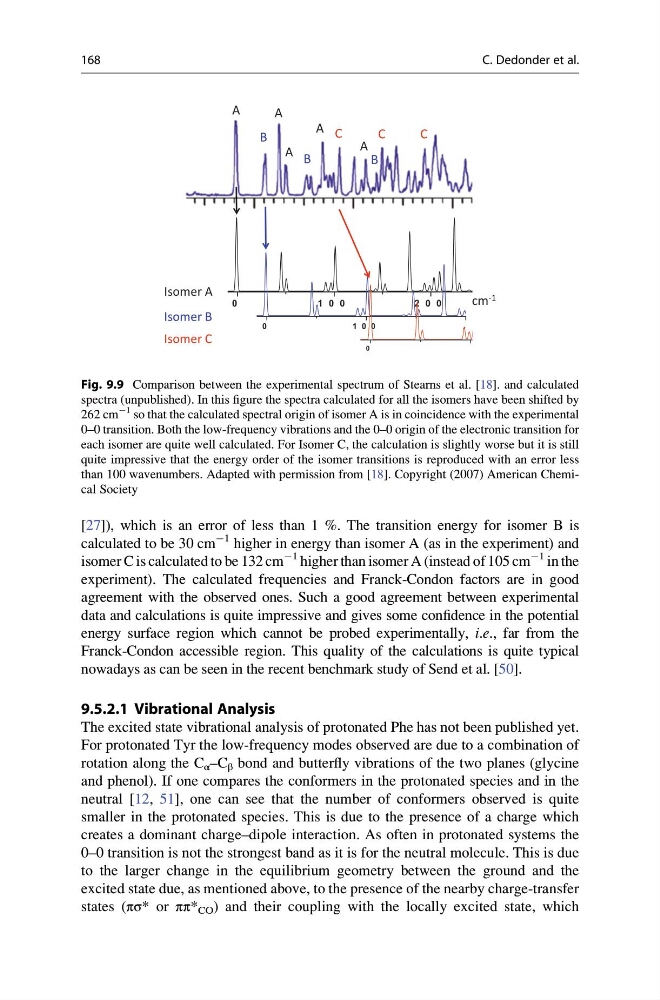
[27]), which is an error of less than 1 %. The transition energy for isomer B is
calculated to be 30 cm
À1 higher in energy than isomer A (as in the experiment) and
isomer C is calculated to be 132 cm
À1 higher than isomer A (instead of 105 cm
À1 in the
experiment). The calculated frequencies and Franck-Condon factors are in good
agreement with the observed ones. Such a good agreement between experimental
data and calculations is quite impressive and gives some confidence in the potential
energy surface region which cannot be probed experimentally, i.e., far from the
Franck-Condon accessible region. This quality of the calculations is quite typical
nowadays as can be seen in the recent benchmark study of Send et al. [50].
9.5.2.1 Vibrational Analysis
The excited state vibrational analysis of protonated Phe has not been published yet.
For protonated Tyr the low-frequency modes observed are due to a combination of
rotation along the C α –C β bond and butterfly vibrations of the two planes (glycine
and phenol). If one compares the conformers in the protonated species and in the
neutral [12, 51], one can see that the number of conformers observed is quite
smaller in the protonated species. This is due to the presence of a charge which
creates a dominant charge–dipole interaction. As often in protonated systems the
0–0 transition is not the strongest band as it is for the neutral molecule. This is due
to the larger change in the equilibrium geometry between the ground and the
excited state due, as mentioned above, to the presence of the nearby charge-transfer
states (πσ* or ππ* CO ) and their coupling with the locally excited state, which
0
1 0 0
2 0 0
0
0
2
0
0
1
0
Isomer B
Isomer C
0
0
1
0
Isomer A
B
B
cm -1
A
B
A
A
A
A
C
C
C
Fig. 9.9 Comparison between the experimental spectrum of Stearns et al. [18]. and calculated
spectra (unpublished). In this figure the spectra calculated for all the isomers have been shifted by
262 cm
À1 so that the calculated spectral origin of isomer A is in coincidence with the experimental
0–0 transition. Both the low-frequency vibrations and the 0–0 origin of the electronic transition for
each isomer are quite well calculated. For Isomer C, the calculation is slightly worse but it is still
quite impressive that the energy order of the isomer transitions is reproduced with an error less
than 100 wavenumbers. Adapted with permission from [18]. Copyright (2007) American Chemical Society
168
C. Dedonder et al.
calculated to be 30 cm
À1 higher in energy than isomer A (as in the experiment) and
isomer C is calculated to be 132 cm
À1 higher than isomer A (instead of 105 cm
À1 in the
experiment). The calculated frequencies and Franck-Condon factors are in good
agreement with the observed ones. Such a good agreement between experimental
data and calculations is quite impressive and gives some confidence in the potential
energy surface region which cannot be probed experimentally, i.e., far from the
Franck-Condon accessible region. This quality of the calculations is quite typical
nowadays as can be seen in the recent benchmark study of Send et al. [50].
9.5.2.1 Vibrational Analysis
The excited state vibrational analysis of protonated Phe has not been published yet.
For protonated Tyr the low-frequency modes observed are due to a combination of
rotation along the C α –C β bond and butterfly vibrations of the two planes (glycine
and phenol). If one compares the conformers in the protonated species and in the
neutral [12, 51], one can see that the number of conformers observed is quite
smaller in the protonated species. This is due to the presence of a charge which
creates a dominant charge–dipole interaction. As often in protonated systems the
0–0 transition is not the strongest band as it is for the neutral molecule. This is due
to the larger change in the equilibrium geometry between the ground and the
excited state due, as mentioned above, to the presence of the nearby charge-transfer
states (πσ* or ππ* CO ) and their coupling with the locally excited state, which
0
1 0 0
2 0 0
0
0
2
0
0
1
0
Isomer B
Isomer C
0
0
1
0
Isomer A
B
B
cm -1
A
B
A
A
A
A
C
C
C
Fig. 9.9 Comparison between the experimental spectrum of Stearns et al. [18]. and calculated
spectra (unpublished). In this figure the spectra calculated for all the isomers have been shifted by
262 cm
À1 so that the calculated spectral origin of isomer A is in coincidence with the experimental
0–0 transition. Both the low-frequency vibrations and the 0–0 origin of the electronic transition for
each isomer are quite well calculated. For Isomer C, the calculation is slightly worse but it is still
quite impressive that the energy order of the isomer transitions is reproduced with an error less
than 100 wavenumbers. Adapted with permission from [18]. Copyright (2007) American Chemical Society
168
C. Dedonder et al.