

spectrum in solution. Colour tuning was observed for other examples, such as visual
opsins. In this section, we discuss spectra of chromophores within their protein
hosts. We directly address the effect of the protein environment on the optical
properties of the heme group without any external factors. The photodetachment
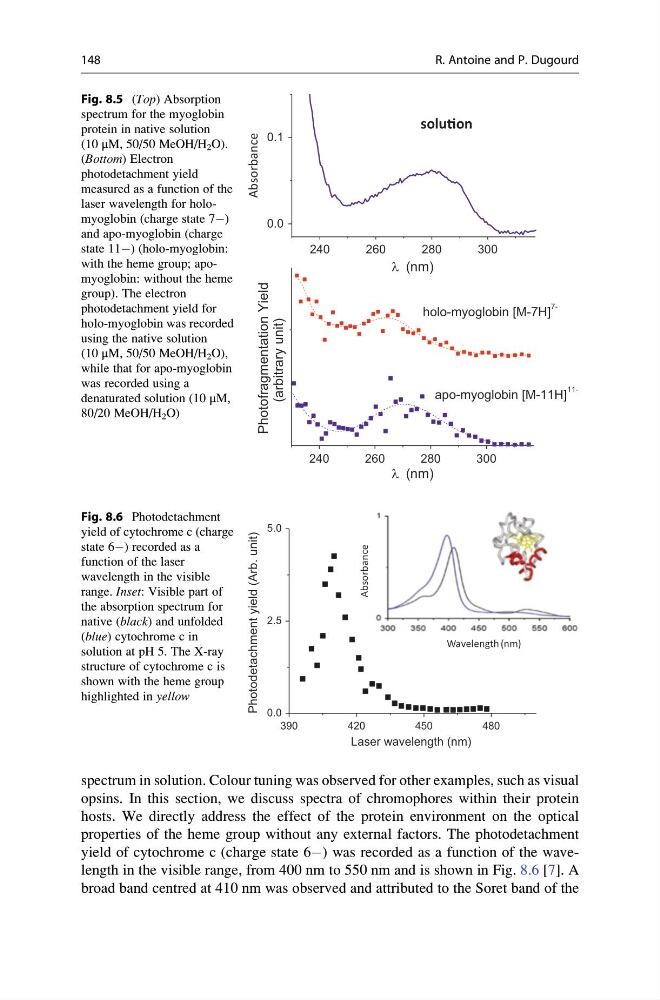
yield of cytochrome c (charge state 6À) was recorded as a function of the wavelength in the visible range, from 400 nm to 550 nm and is shown in Fig. 8.6 [7]. A
broad band centred at 410 nm was observed and attributed to the Soret band of the
240
260
280
300
apo-myoglobin [M-11H]
11l (nm)
Photofragmentation Yield
(arbitrary unit)
holo-myoglobin [M-7H]
7240
260
280
300
0.0
0.1
l (nm)
soluƟon
Absorbance
Fig. 8.5 (Top) Absorption
spectrum for the myoglobin
protein in native solution
(10 μM, 50/50 MeOH/H 2 O).
(Bottom) Electron
photodetachment yield
measured as a function of the
laser wavelength for holomyoglobin (charge state 7À)
and apo-myoglobin (charge
state 11À) (holo-myoglobin:
with the heme group; apomyoglobin: without the heme
group). The electron
photodetachment yield for
holo-myoglobin was recorded
using the native solution
(10 μM, 50/50 MeOH/H 2 O),
while that for apo-myoglobin
was recorded using a
denaturated solution (10 μM,
80/20 MeOH/H 2 O)
390
420
450
480
0.0
2.5
5.0
Photodetachment yield (Arb. unit)
Laser wavelength (nm)
Absorbance
Wavelength (nm)
Fig. 8.6 Photodetachment
yield of cytochrome c (charge
state 6À) recorded as a
function of the laser
wavelength in the visible
range. Inset: Visible part of
the absorption spectrum for
native (black) and unfolded
(blue) cytochrome c in
solution at pH 5. The X-ray
structure of cytochrome c is
shown with the heme group
highlighted in yellow
148
R. Antoine and P. Dugourd
opsins. In this section, we discuss spectra of chromophores within their protein
hosts. We directly address the effect of the protein environment on the optical
properties of the heme group without any external factors. The photodetachment
yield of cytochrome c (charge state 6À) was recorded as a function of the wavelength in the visible range, from 400 nm to 550 nm and is shown in Fig. 8.6 [7]. A
broad band centred at 410 nm was observed and attributed to the Soret band of the
240
260
280
300
apo-myoglobin [M-11H]
11l (nm)
Photofragmentation Yield
(arbitrary unit)
holo-myoglobin [M-7H]
7240
260
280
300
0.0
0.1
l (nm)
soluƟon
Absorbance
Fig. 8.5 (Top) Absorption
spectrum for the myoglobin
protein in native solution
(10 μM, 50/50 MeOH/H 2 O).
(Bottom) Electron
photodetachment yield
measured as a function of the
laser wavelength for holomyoglobin (charge state 7À)
and apo-myoglobin (charge
state 11À) (holo-myoglobin:
with the heme group; apomyoglobin: without the heme
group). The electron
photodetachment yield for
holo-myoglobin was recorded
using the native solution
(10 μM, 50/50 MeOH/H 2 O),
while that for apo-myoglobin
was recorded using a
denaturated solution (10 μM,
80/20 MeOH/H 2 O)
390
420
450
480
0.0
2.5
5.0
Photodetachment yield (Arb. unit)
Laser wavelength (nm)
Absorbance
Wavelength (nm)
Fig. 8.6 Photodetachment
yield of cytochrome c (charge
state 6À) recorded as a
function of the laser
wavelength in the visible
range. Inset: Visible part of
the absorption spectrum for
native (black) and unfolded
(blue) cytochrome c in
solution at pH 5. The X-ray
structure of cytochrome c is
shown with the heme group
highlighted in yellow
148
R. Antoine and P. Dugourd