

This supports our findings for a relatively long lifetime of the anion in the S 1 state,
which is consistent with a bound character of the first excited state with respect to
electron emission.
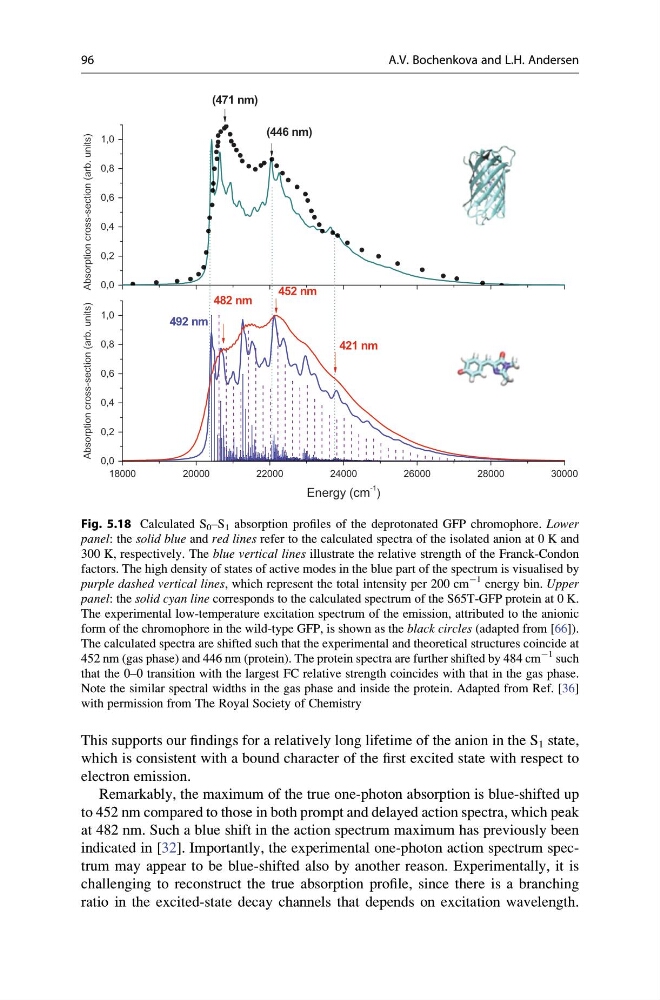
Remarkably, the maximum of the true one-photon absorption is blue-shifted up
to 452 nm compared to those in both prompt and delayed action spectra, which peak
at 482 nm. Such a blue shift in the action spectrum maximum has previously been
indicated in [32]. Importantly, the experimental one-photon action spectrum spectrum may appear to be blue-shifted also by another reason. Experimentally, it is
challenging to reconstruct the true absorption profile, since there is a branching
ratio in the excited-state decay channels that depends on excitation wavelength.
0,0
0,2
0,4
0,6
0,8
1,0
(471 nm)
(446 nm)
482 nm
421 nm
452 nm
Absorption cross-section (arb. units) Absorption cross-section (arb. units)
492 nm
18000
20000
22000
24000
26000
28000
30000
0,0
0,2
0,4
0,6
0,8
1,0
Energy (cm
-1
)
Fig. 5.18 Calculated S 0 –S 1 absorption profiles of the deprotonated GFP chromophore. Lower
panel: the solid blue and red lines refer to the calculated spectra of the isolated anion at 0 K and
300 K, respectively. The blue vertical lines illustrate the relative strength of the Franck-Condon
factors. The high density of states of active modes in the blue part of the spectrum is visualised by
purple dashed vertical lines, which represent the total intensity per 200 cm
À1 energy bin. Upper
panel: the solid cyan line corresponds to the calculated spectrum of the S65T-GFP protein at 0 K.
The experimental low-temperature excitation spectrum of the emission, attributed to the anionic
form of the chromophore in the wild-type GFP, is shown as the black circles (adapted from [66]).
The calculated spectra are shifted such that the experimental and theoretical structures coincide at
452 nm (gas phase) and 446 nm (protein). The protein spectra are further shifted by 484 cm
À1 such
that the 0–0 transition with the largest FC relative strength coincides with that in the gas phase.
Note the similar spectral widths in the gas phase and inside the protein. Adapted from Ref. [36]
with permission from The Royal Society of Chemistry
96
A.V. Bochenkova and L.H. Andersen
which is consistent with a bound character of the first excited state with respect to
electron emission.
Remarkably, the maximum of the true one-photon absorption is blue-shifted up
to 452 nm compared to those in both prompt and delayed action spectra, which peak
at 482 nm. Such a blue shift in the action spectrum maximum has previously been
indicated in [32]. Importantly, the experimental one-photon action spectrum spectrum may appear to be blue-shifted also by another reason. Experimentally, it is
challenging to reconstruct the true absorption profile, since there is a branching
ratio in the excited-state decay channels that depends on excitation wavelength.
0,0
0,2
0,4
0,6
0,8
1,0
(471 nm)
(446 nm)
482 nm
421 nm
452 nm
Absorption cross-section (arb. units) Absorption cross-section (arb. units)
492 nm
18000
20000
22000
24000
26000
28000
30000
0,0
0,2
0,4
0,6
0,8
1,0
Energy (cm
-1
)
Fig. 5.18 Calculated S 0 –S 1 absorption profiles of the deprotonated GFP chromophore. Lower
panel: the solid blue and red lines refer to the calculated spectra of the isolated anion at 0 K and
300 K, respectively. The blue vertical lines illustrate the relative strength of the Franck-Condon
factors. The high density of states of active modes in the blue part of the spectrum is visualised by
purple dashed vertical lines, which represent the total intensity per 200 cm
À1 energy bin. Upper
panel: the solid cyan line corresponds to the calculated spectrum of the S65T-GFP protein at 0 K.
The experimental low-temperature excitation spectrum of the emission, attributed to the anionic
form of the chromophore in the wild-type GFP, is shown as the black circles (adapted from [66]).
The calculated spectra are shifted such that the experimental and theoretical structures coincide at
452 nm (gas phase) and 446 nm (protein). The protein spectra are further shifted by 484 cm
À1 such
that the 0–0 transition with the largest FC relative strength coincides with that in the gas phase.
Note the similar spectral widths in the gas phase and inside the protein. Adapted from Ref. [36]
with permission from The Royal Society of Chemistry
96
A.V. Bochenkova and L.H. Andersen