

1 Nanoplasmonics: From Present into Future
75
0.5
1
t, ps
N n
(a)
10 2
10
10 -1
10 -2
1
N n
(e)
1
2
t, ps
10 2
10
10 -1
10 -2
1
0.5
1
t, ps
n 21
0
0.5
n 21
1
2
t, ps
0
0.5
-0.5
0
0.5
-0.5
n 21
0.1 0.2 0.3 0.4
t, ps
10 2
10 -4
10 -2
1
0.1 0.2 0.3 0.4
t, ps
(g) N n
10 2
10 -4
10 -2
1
0.1 0.2 0.3 0.4
t, ps
(c)
(b)
(f)
(h)
(d)
N n
t, ps
n 21
0
0.5
-0.5
0.1 0.2 0.3 0.4
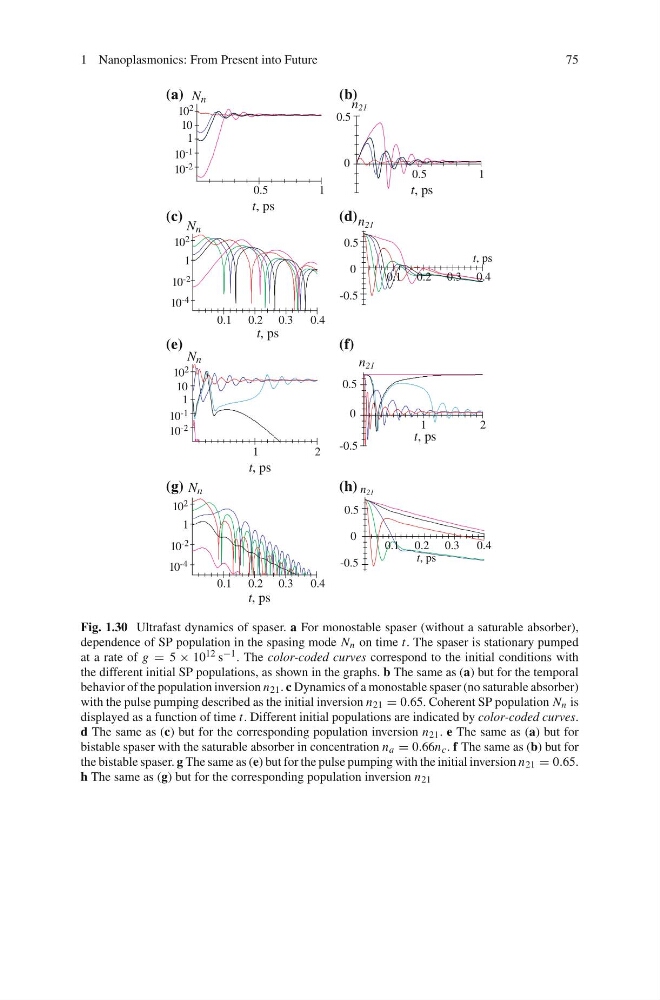
Fig. 1.30 Ultrafast dynamics of spaser. a For monostable spaser (without a saturable absorber),
dependence of SP population in the spasing mode N n on time t. The spaser is stationary pumped
at a rate of g = 5 × 10 12 s −1 . The color-coded curves correspond to the initial conditions with
the different initial SP populations, as shown in the graphs. b The same as (a) but for the temporal
behavior of the population inversion n 21 . c Dynamics of a monostable spaser (no saturable absorber)
with the pulse pumping described as the initial inversion n 21 = 0.65. Coherent SP population N n is
displayed as a function of time t. Different initial populations are indicated by color-coded curves.
d The same as (c) but for the corresponding population inversion n 21 . e The same as (a) but for
bistable spaser with the saturable absorber in concentration n a = 0.66n c . f The same as (b) but for
the bistable spaser. g The same as (e) but for the pulse pumping with the initial inversion n 21 = 0.65.
h The same as (g) but for the corresponding population inversion n 21
75
0.5
1
t, ps
N n
(a)
10 2
10
10 -1
10 -2
1
N n
(e)
1
2
t, ps
10 2
10
10 -1
10 -2
1
0.5
1
t, ps
n 21
0
0.5
n 21
1
2
t, ps
0
0.5
-0.5
0
0.5
-0.5
n 21
0.1 0.2 0.3 0.4
t, ps
10 2
10 -4
10 -2
1
0.1 0.2 0.3 0.4
t, ps
(g) N n
10 2
10 -4
10 -2
1
0.1 0.2 0.3 0.4
t, ps
(c)
(b)
(f)
(h)
(d)
N n
t, ps
n 21
0
0.5
-0.5
0.1 0.2 0.3 0.4
Fig. 1.30 Ultrafast dynamics of spaser. a For monostable spaser (without a saturable absorber),
dependence of SP population in the spasing mode N n on time t. The spaser is stationary pumped
at a rate of g = 5 × 10 12 s −1 . The color-coded curves correspond to the initial conditions with
the different initial SP populations, as shown in the graphs. b The same as (a) but for the temporal
behavior of the population inversion n 21 . c Dynamics of a monostable spaser (no saturable absorber)
with the pulse pumping described as the initial inversion n 21 = 0.65. Coherent SP population N n is
displayed as a function of time t. Different initial populations are indicated by color-coded curves.
d The same as (c) but for the corresponding population inversion n 21 . e The same as (a) but for
bistable spaser with the saturable absorber in concentration n a = 0.66n c . f The same as (b) but for
the bistable spaser. g The same as (e) but for the pulse pumping with the initial inversion n 21 = 0.65.
h The same as (g) but for the corresponding population inversion n 21