

1 Nanoplasmonics: From Present into Future
53
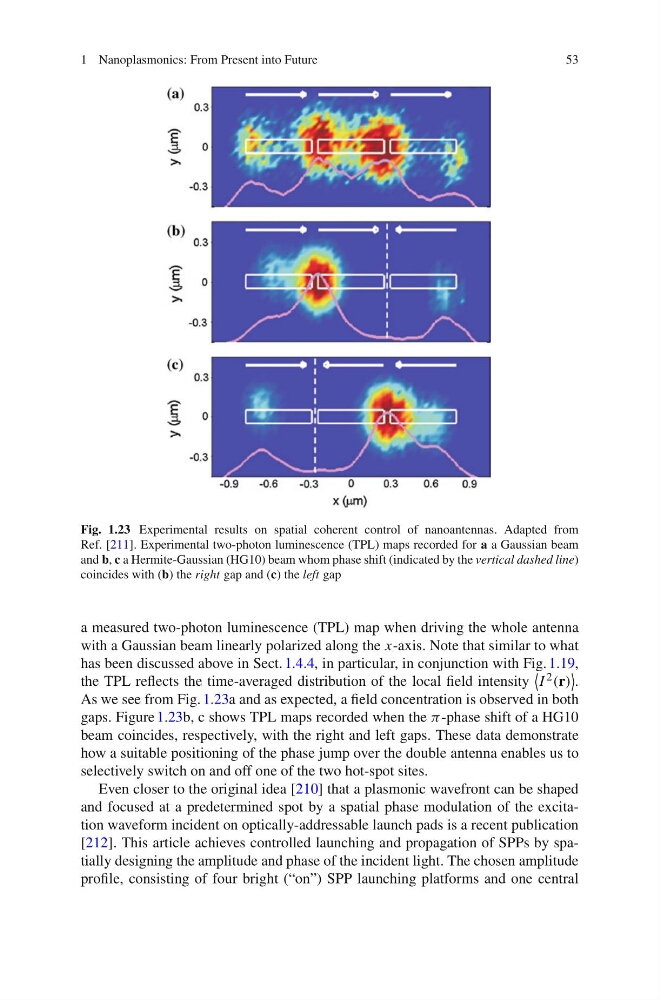
Fig. 1.23 Experimental results on spatial coherent control of nanoantennas. Adapted from
Ref. [211]. Experimental two-photon luminescence (TPL) maps recorded for a a Gaussian beam
and b, c a Hermite-Gaussian (HG10) beam whom phase shift (indicated by the vertical dashed line)
coincides with (b) the right gap and (c) the left gap
a measured two-photon luminescence (TPL) map when driving the whole antenna
with a Gaussian beam linearly polarized along the x-axis. Note that similar to what
has been discussed above in Sect. 1.4.4, in particular, in conjunction with Fig. 1.19,
the TPL reflects the time-averaged distribution of the local field intensity
I 2 (r)
.
As we see from Fig. 1.23a and as expected, a field concentration is observed in both
gaps. Figure 1.23b, c shows TPL maps recorded when the π -phase shift of a HG10
beam coincides, respectively, with the right and left gaps. These data demonstrate
how a suitable positioning of the phase jump over the double antenna enables us to
selectively switch on and off one of the two hot-spot sites.
Even closer to the original idea [210] that a plasmonic wavefront can be shaped
and focused at a predetermined spot by a spatial phase modulation of the excitation waveform incident on optically-addressable launch pads is a recent publication
[212]. This article achieves controlled launching and propagation of SPPs by spatially designing the amplitude and phase of the incident light. The chosen amplitude
profile, consisting of four bright (“on”) SPP launching platforms and one central
53
Fig. 1.23 Experimental results on spatial coherent control of nanoantennas. Adapted from
Ref. [211]. Experimental two-photon luminescence (TPL) maps recorded for a a Gaussian beam
and b, c a Hermite-Gaussian (HG10) beam whom phase shift (indicated by the vertical dashed line)
coincides with (b) the right gap and (c) the left gap
a measured two-photon luminescence (TPL) map when driving the whole antenna
with a Gaussian beam linearly polarized along the x-axis. Note that similar to what
has been discussed above in Sect. 1.4.4, in particular, in conjunction with Fig. 1.19,
the TPL reflects the time-averaged distribution of the local field intensity
I 2 (r)
.
As we see from Fig. 1.23a and as expected, a field concentration is observed in both
gaps. Figure 1.23b, c shows TPL maps recorded when the π -phase shift of a HG10
beam coincides, respectively, with the right and left gaps. These data demonstrate
how a suitable positioning of the phase jump over the double antenna enables us to
selectively switch on and off one of the two hot-spot sites.
Even closer to the original idea [210] that a plasmonic wavefront can be shaped
and focused at a predetermined spot by a spatial phase modulation of the excitation waveform incident on optically-addressable launch pads is a recent publication
[212]. This article achieves controlled launching and propagation of SPPs by spatially designing the amplitude and phase of the incident light. The chosen amplitude
profile, consisting of four bright (“on”) SPP launching platforms and one central