

1 Nanoplasmonics: From Present into Future
33
I(r) (Arb. u.)
I(r) (Arb. u.)
900
700
500
300
0
5 0
2 5
y ( n m )
10 3
10 2
I
(Arb. u.)
20 30
40
50
60
x, y (nm)
1100
700
300
0 0
25
50
75
x (nm )
25
50
0
x (nm )
2 5
5 0 7 5
0
y ( n m )
100
0
8
0
6
0
4
0
0
2
x, y (nm)
10 3
I
(Arb. u.)
(a)
(b)
(c)
(d)
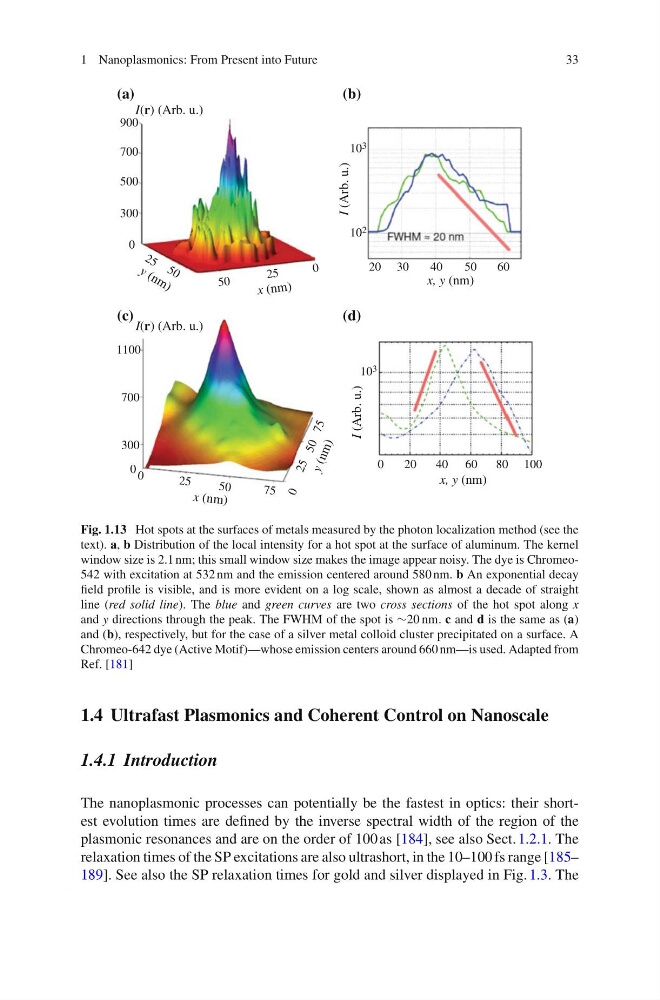
Fig. 1.13 Hot spots at the surfaces of metals measured by the photon localization method (see the
text). a, b Distribution of the local intensity for a hot spot at the surface of aluminum. The kernel
window size is 2.1 nm; this small window size makes the image appear noisy. The dye is Chromeo542 with excitation at 532 nm and the emission centered around 580 nm. b An exponential decay
field profile is visible, and is more evident on a log scale, shown as almost a decade of straight
line (red solid line). The blue and green curves are two cross sections of the hot spot along x
and y directions through the peak. The FWHM of the spot is ∼20 nm. c and d is the same as (a)
and (b), respectively, but for the case of a silver metal colloid cluster precipitated on a surface. A
Chromeo-642 dye (Active Motif)—whose emission centers around 660 nm—is used. Adapted from
Ref. [181]
1.4 Ultrafast Plasmonics and Coherent Control on Nanoscale
1.4.1 Introduction
The nanoplasmonic processes can potentially be the fastest in optics: their shortest evolution times are defined by the inverse spectral width of the region of the
plasmonic resonances and are on the order of 100 as [184], see also Sect. 1.2.1. The
relaxation times of the SP excitations are also ultrashort, in the 10–100 fs range [185–
189]. See also the SP relaxation times for gold and silver displayed in Fig. 1.3. The
33
I(r) (Arb. u.)
I(r) (Arb. u.)
900
700
500
300
0
5 0
2 5
y ( n m )
10 3
10 2
I
(Arb. u.)
20 30
40
50
60
x, y (nm)
1100
700
300
0 0
25
50
75
x (nm )
25
50
0
x (nm )
2 5
5 0 7 5
0
y ( n m )
100
0
8
0
6
0
4
0
0
2
x, y (nm)
10 3
I
(Arb. u.)
(a)
(b)
(c)
(d)
Fig. 1.13 Hot spots at the surfaces of metals measured by the photon localization method (see the
text). a, b Distribution of the local intensity for a hot spot at the surface of aluminum. The kernel
window size is 2.1 nm; this small window size makes the image appear noisy. The dye is Chromeo542 with excitation at 532 nm and the emission centered around 580 nm. b An exponential decay
field profile is visible, and is more evident on a log scale, shown as almost a decade of straight
line (red solid line). The blue and green curves are two cross sections of the hot spot along x
and y directions through the peak. The FWHM of the spot is ∼20 nm. c and d is the same as (a)
and (b), respectively, but for the case of a silver metal colloid cluster precipitated on a surface. A
Chromeo-642 dye (Active Motif)—whose emission centers around 660 nm—is used. Adapted from
Ref. [181]
1.4 Ultrafast Plasmonics and Coherent Control on Nanoscale
1.4.1 Introduction
The nanoplasmonic processes can potentially be the fastest in optics: their shortest evolution times are defined by the inverse spectral width of the region of the
plasmonic resonances and are on the order of 100 as [184], see also Sect. 1.2.1. The
relaxation times of the SP excitations are also ultrashort, in the 10–100 fs range [185–
189]. See also the SP relaxation times for gold and silver displayed in Fig. 1.3. The