

11 Plasmonic Functionalities Based on Detuned Electrical Dipoles
413
(b)
(a)
(c)
(e)
(d)
(f)
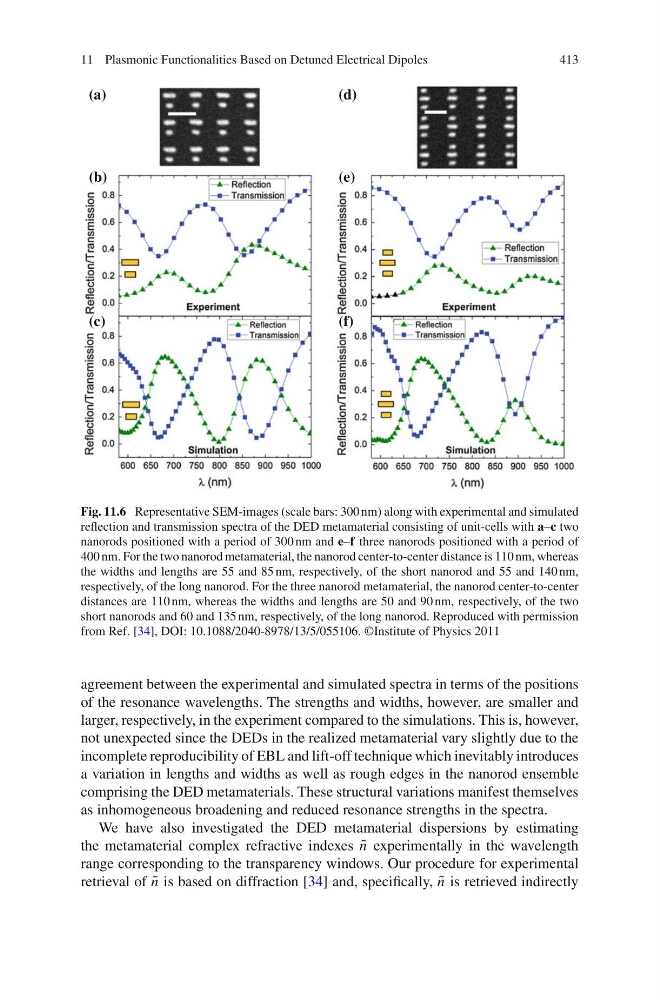
Fig. 11.6 Representative SEM-images (scale bars: 300 nm) along with experimental and simulated
reflection and transmission spectra of the DED metamaterial consisting of unit-cells with a–c two
nanorods positioned with a period of 300 nm and e–f three nanorods positioned with a period of
400 nm. For the two nanorod metamaterial, the nanorod center-to-center distance is 110 nm, whereas
the widths and lengths are 55 and 85 nm, respectively, of the short nanorod and 55 and 140 nm,
respectively, of the long nanorod. For the three nanorod metamaterial, the nanorod center-to-center
distances are 110 nm, whereas the widths and lengths are 50 and 90 nm, respectively, of the two
short nanorods and 60 and 135 nm, respectively, of the long nanorod. Reproduced with permission
from Ref. [34], DOI: 10.1088/2040-8978/13/5/055106. ©Institute of Physics 2011
agreement between the experimental and simulated spectra in terms of the positions
of the resonance wavelengths. The strengths and widths, however, are smaller and
larger, respectively, in the experiment compared to the simulations. This is, however,
not unexpected since the DEDs in the realized metamaterial vary slightly due to the
incomplete reproducibility of EBL and lift-off technique which inevitably introduces
a variation in lengths and widths as well as rough edges in the nanorod ensemble
comprising the DED metamaterials. These structural variations manifest themselves
as inhomogeneous broadening and reduced resonance strengths in the spectra.
We have also investigated the DED metamaterial dispersions by estimating
the metamaterial complex refractive indexes ˜
n experimentally in the wavelength
range corresponding to the transparency windows. Our procedure for experimental
retrieval of ˜
n is based on diffraction [34] and, specifically, ˜
n is retrieved indirectly
413
(b)
(a)
(c)
(e)
(d)
(f)
Fig. 11.6 Representative SEM-images (scale bars: 300 nm) along with experimental and simulated
reflection and transmission spectra of the DED metamaterial consisting of unit-cells with a–c two
nanorods positioned with a period of 300 nm and e–f three nanorods positioned with a period of
400 nm. For the two nanorod metamaterial, the nanorod center-to-center distance is 110 nm, whereas
the widths and lengths are 55 and 85 nm, respectively, of the short nanorod and 55 and 140 nm,
respectively, of the long nanorod. For the three nanorod metamaterial, the nanorod center-to-center
distances are 110 nm, whereas the widths and lengths are 50 and 90 nm, respectively, of the two
short nanorods and 60 and 135 nm, respectively, of the long nanorod. Reproduced with permission
from Ref. [34], DOI: 10.1088/2040-8978/13/5/055106. ©Institute of Physics 2011
agreement between the experimental and simulated spectra in terms of the positions
of the resonance wavelengths. The strengths and widths, however, are smaller and
larger, respectively, in the experiment compared to the simulations. This is, however,
not unexpected since the DEDs in the realized metamaterial vary slightly due to the
incomplete reproducibility of EBL and lift-off technique which inevitably introduces
a variation in lengths and widths as well as rough edges in the nanorod ensemble
comprising the DED metamaterials. These structural variations manifest themselves
as inhomogeneous broadening and reduced resonance strengths in the spectra.
We have also investigated the DED metamaterial dispersions by estimating
the metamaterial complex refractive indexes ˜
n experimentally in the wavelength
range corresponding to the transparency windows. Our procedure for experimental
retrieval of ˜
n is based on diffraction [34] and, specifically, ˜
n is retrieved indirectly