

1 Nanoplasmonics: From Present into Future
85
(eV)
1 1.5 2 2.5 3
0.5
1
1.5
Spasing Condition
1 1.5 2 2.5 3
0.5
1
1.5
(eV)
Spasing Condition
(a)
(b)
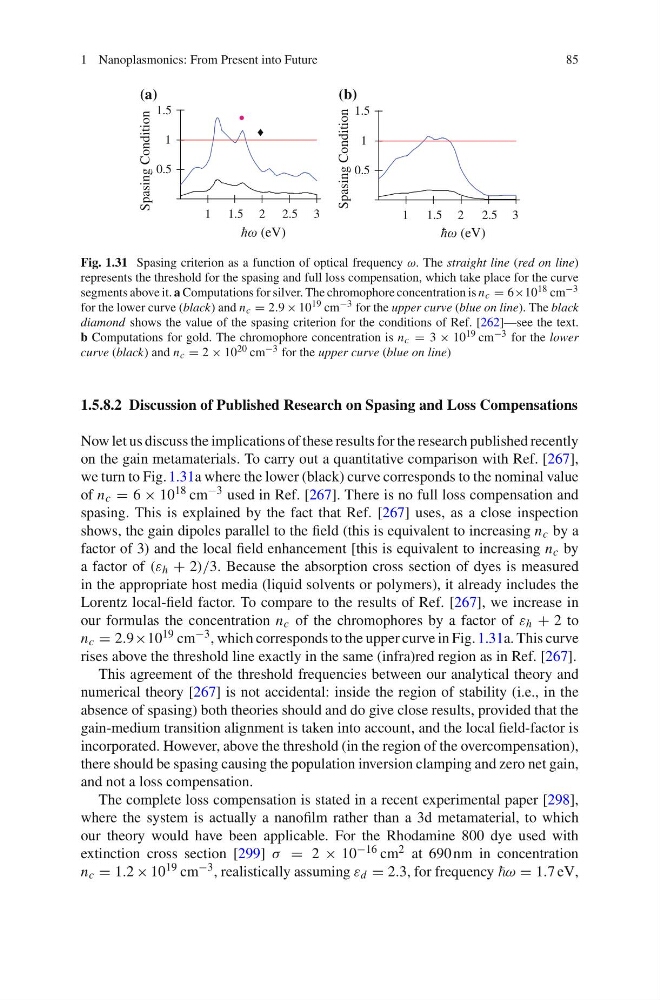
Fig. 1.31 Spasing criterion as a function of optical frequency ω. The straight line (red on line)
represents the threshold for the spasing and full loss compensation, which take place for the curve
segments above it. a Computations for silver. The chromophore concentration is n c = 6×10 18 cm −3
for the lower curve (black) and n c = 2.9 × 10 19 cm −3 for the upper curve (blue on line). The black
diamond shows the value of the spasing criterion for the conditions of Ref. [262]—see the text.
b Computations for gold. The chromophore concentration is n c = 3 × 10 19 cm −3 for the lower
curve (black) and n c = 2 × 10 20 cm −3 for the upper curve (blue on line)
1.5.8.2 Discussion of Published Research on Spasing and Loss Compensations
Now let us discuss the implications of these results for the research published recently
on the gain metamaterials. To carry out a quantitative comparison with Ref. [267],
we turn to Fig. 1.31a where the lower (black) curve corresponds to the nominal value
of n c = 6 × 10 18 cm −3 used in Ref. [267]. There is no full loss compensation and
spasing. This is explained by the fact that Ref. [267] uses, as a close inspection
shows, the gain dipoles parallel to the field (this is equivalent to increasing n c by a
factor of 3) and the local field enhancement [this is equivalent to increasing n c by
a factor of (ε h + 2)/3. Because the absorption cross section of dyes is measured
in the appropriate host media (liquid solvents or polymers), it already includes the
Lorentz local-field factor. To compare to the results of Ref. [267], we increase in
our formulas the concentration n c of the chromophores by a factor of ε h + 2 to
n c = 2.9×10 19 cm −3 , which corresponds to the upper curve in Fig. 1.31a. This curve
rises above the threshold line exactly in the same (infra)red region as in Ref. [267].
This agreement of the threshold frequencies between our analytical theory and
numerical theory [267] is not accidental: inside the region of stability (i.e., in the
absence of spasing) both theories should and do give close results, provided that the
gain-medium transition alignment is taken into account, and the local field-factor is
incorporated. However, above the threshold (in the region of the overcompensation),
there should be spasing causing the population inversion clamping and zero net gain,
and not a loss compensation.
The complete loss compensation is stated in a recent experimental paper [298],
where the system is actually a nanofilm rather than a 3d metamaterial, to which
our theory would have been applicable. For the Rhodamine 800 dye used with
extinction cross section [299] σ = 2 × 10 −16 cm 2 at 690 nm in concentration
n c = 1.2 × 10 19 cm −3 , realistically assuming ε d = 2.3, for frequency ω = 1.7 eV,
85
(eV)
1 1.5 2 2.5 3
0.5
1
1.5
Spasing Condition
1 1.5 2 2.5 3
0.5
1
1.5
(eV)
Spasing Condition
(a)
(b)
Fig. 1.31 Spasing criterion as a function of optical frequency ω. The straight line (red on line)
represents the threshold for the spasing and full loss compensation, which take place for the curve
segments above it. a Computations for silver. The chromophore concentration is n c = 6×10 18 cm −3
for the lower curve (black) and n c = 2.9 × 10 19 cm −3 for the upper curve (blue on line). The black
diamond shows the value of the spasing criterion for the conditions of Ref. [262]—see the text.
b Computations for gold. The chromophore concentration is n c = 3 × 10 19 cm −3 for the lower
curve (black) and n c = 2 × 10 20 cm −3 for the upper curve (blue on line)
1.5.8.2 Discussion of Published Research on Spasing and Loss Compensations
Now let us discuss the implications of these results for the research published recently
on the gain metamaterials. To carry out a quantitative comparison with Ref. [267],
we turn to Fig. 1.31a where the lower (black) curve corresponds to the nominal value
of n c = 6 × 10 18 cm −3 used in Ref. [267]. There is no full loss compensation and
spasing. This is explained by the fact that Ref. [267] uses, as a close inspection
shows, the gain dipoles parallel to the field (this is equivalent to increasing n c by a
factor of 3) and the local field enhancement [this is equivalent to increasing n c by
a factor of (ε h + 2)/3. Because the absorption cross section of dyes is measured
in the appropriate host media (liquid solvents or polymers), it already includes the
Lorentz local-field factor. To compare to the results of Ref. [267], we increase in
our formulas the concentration n c of the chromophores by a factor of ε h + 2 to
n c = 2.9×10 19 cm −3 , which corresponds to the upper curve in Fig. 1.31a. This curve
rises above the threshold line exactly in the same (infra)red region as in Ref. [267].
This agreement of the threshold frequencies between our analytical theory and
numerical theory [267] is not accidental: inside the region of stability (i.e., in the
absence of spasing) both theories should and do give close results, provided that the
gain-medium transition alignment is taken into account, and the local field-factor is
incorporated. However, above the threshold (in the region of the overcompensation),
there should be spasing causing the population inversion clamping and zero net gain,
and not a loss compensation.
The complete loss compensation is stated in a recent experimental paper [298],
where the system is actually a nanofilm rather than a 3d metamaterial, to which
our theory would have been applicable. For the Rhodamine 800 dye used with
extinction cross section [299] σ = 2 × 10 −16 cm 2 at 690 nm in concentration
n c = 1.2 × 10 19 cm −3 , realistically assuming ε d = 2.3, for frequency ω = 1.7 eV,