

4 Spectral Analysis in the NIR Spectroscopy
77
Analytical solutions of the first and second derivatives of the band are
dA
dx
= −2
x − x 0
w 2 A = −2
α(x − x 0 )
w 2
exp
−
x − x 0
w
2
(4.6)
d
2 A
dx 2 = −2
A
w 2
1 − 2
(x − x 0 )
2
w 2
= −2
α
w 2
1 − 2
(x − x 0 )
2
w 2
exp
−
x − x 0
w
2
(4.7)
respectively, where α is a peak height of the band, and w is proportional to a full
width at the half maximum (FWHM) of the band (ω = FWHM/{Ln (4)}
0.5 ). As
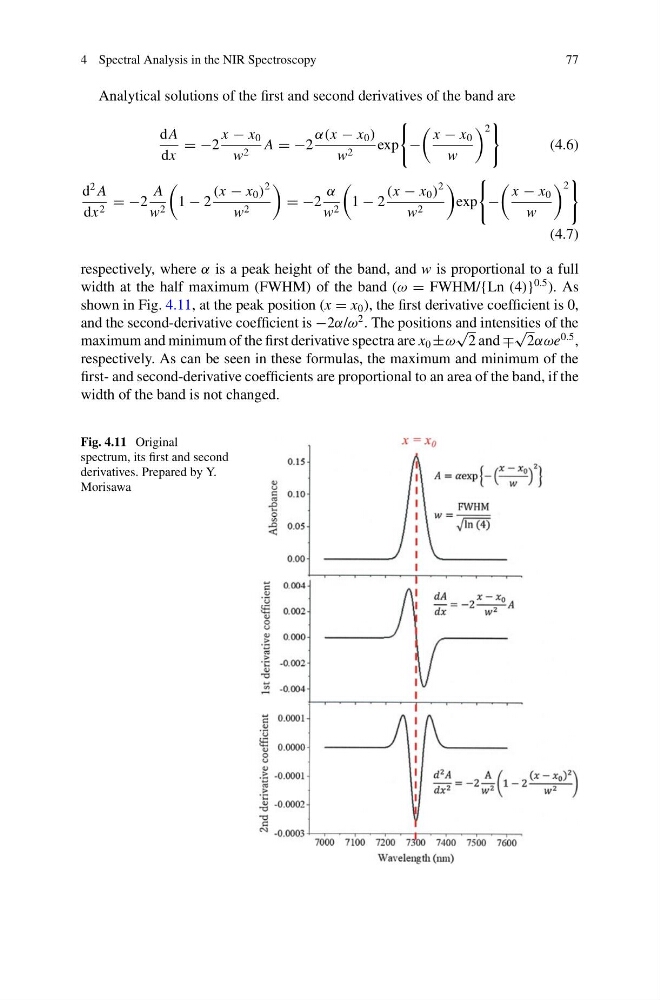
shown in Fig. 4.11, at the peak position (x = x 0 ), the first derivative coefficient is 0,
and the second-derivative coefficient is −2α/ω
2 . The positions and intensities of the
maximum and minimum of the first derivative spectra are x 0 ±ω
√
2 and ∓
√
2αωe
0.5 ,
respectively. As can be seen in these formulas, the maximum and minimum of the
first- and second-derivative coefficients are proportional to an area of the band, if the
width of the band is not changed.
Fig. 4.11 Original
spectrum, its first and second
derivatives. Prepared by Y.
Morisawa
77
Analytical solutions of the first and second derivatives of the band are
dA
dx
= −2
x − x 0
w 2 A = −2
α(x − x 0 )
w 2
exp
−
x − x 0
w
2
(4.6)
d
2 A
dx 2 = −2
A
w 2
1 − 2
(x − x 0 )
2
w 2
= −2
α
w 2
1 − 2
(x − x 0 )
2
w 2
exp
−
x − x 0
w
2
(4.7)
respectively, where α is a peak height of the band, and w is proportional to a full
width at the half maximum (FWHM) of the band (ω = FWHM/{Ln (4)}
0.5 ). As
shown in Fig. 4.11, at the peak position (x = x 0 ), the first derivative coefficient is 0,
and the second-derivative coefficient is −2α/ω
2 . The positions and intensities of the
maximum and minimum of the first derivative spectra are x 0 ±ω
√
2 and ∓
√
2αωe
0.5 ,
respectively. As can be seen in these formulas, the maximum and minimum of the
first- and second-derivative coefficients are proportional to an area of the band, if the
width of the band is not changed.
Fig. 4.11 Original
spectrum, its first and second
derivatives. Prepared by Y.
Morisawa