

70
Y. Ozaki et al.
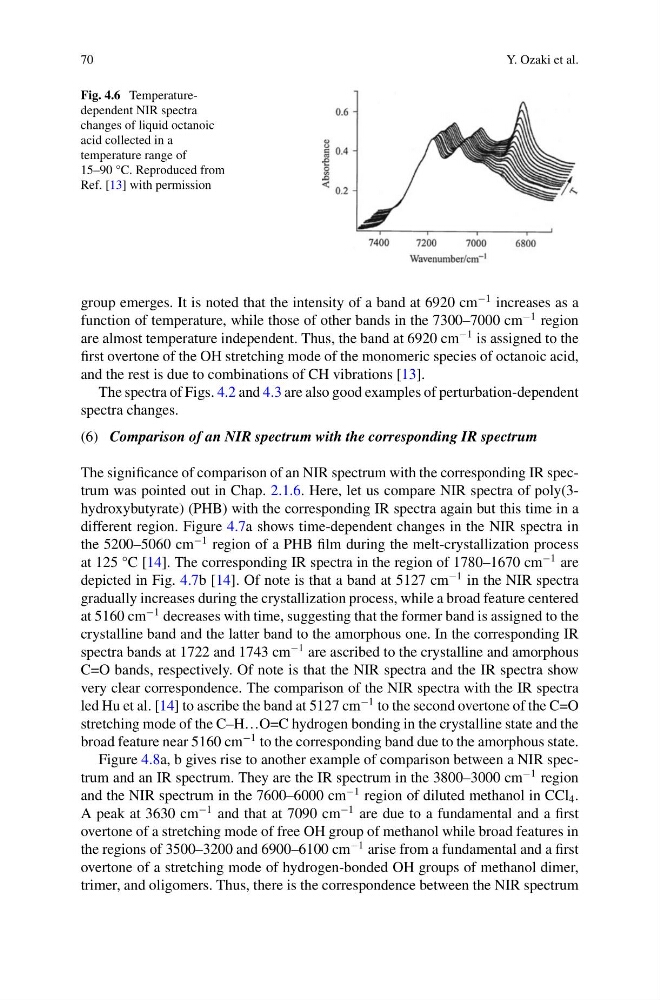
Fig. 4.6 Temperaturedependent NIR spectra
changes of liquid octanoic
acid collected in a
temperature range of
15–90 °C. Reproduced from
Ref. [13] with permission
group emerges. It is noted that the intensity of a band at 6920 cm
−1 increases as a
function of temperature, while those of other bands in the 7300–7000 cm
−1 region
are almost temperature independent. Thus, the band at 6920 cm
−1 is assigned to the
first overtone of the OH stretching mode of the monomeric species of octanoic acid,
and the rest is due to combinations of CH vibrations [13].
The spectra of Figs. 4.2 and 4.3 are also good examples of perturbation-dependent
spectra changes.
(6) Comparison of an NIR spectrum with the corresponding IR spectrum
The significance of comparison of an NIR spectrum with the corresponding IR spectrum was pointed out in Chap. 2.1.6. Here, let us compare NIR spectra of poly(3hydroxybutyrate) (PHB) with the corresponding IR spectra again but this time in a
different region. Figure 4.7a shows time-dependent changes in the NIR spectra in
the 5200–5060 cm
−1 region of a PHB film during the melt-crystallization process
at 125 °C [14]. The corresponding IR spectra in the region of 1780–1670 cm
−1 are
depicted in Fig. 4.7b [14]. Of note is that a band at 5127 cm
−1 in the NIR spectra
gradually increases during the crystallization process, while a broad feature centered
at 5160 cm
−1 decreases with time, suggesting that the former band is assigned to the
crystalline band and the latter band to the amorphous one. In the corresponding IR
spectra bands at 1722 and 1743 cm
−1 are ascribed to the crystalline and amorphous
C=O bands, respectively. Of note is that the NIR spectra and the IR spectra show
very clear correspondence. The comparison of the NIR spectra with the IR spectra
led Hu et al. [14] to ascribe the band at 5127 cm
−1 to the second overtone of the C=O
stretching mode of the C–H…O=C hydrogen bonding in the crystalline state and the
broad feature near 5160 cm
−1 to the corresponding band due to the amorphous state.
Figure 4.8a, b gives rise to another example of comparison between a NIR spectrum and an IR spectrum. They are the IR spectrum in the 3800–3000 cm
−1 region
and the NIR spectrum in the 7600–6000 cm
−1 region of diluted methanol in CCl 4 .
A peak at 3630 cm
−1 and that at 7090 cm
−1 are due to a fundamental and a first
overtone of a stretching mode of free OH group of methanol while broad features in
the regions of 3500–3200 and 6900–6100 cm
−1 arise from a fundamental and a first
overtone of a stretching mode of hydrogen-bonded OH groups of methanol dimer,
trimer, and oligomers. Thus, there is the correspondence between the NIR spectrum
Y. Ozaki et al.
Fig. 4.6 Temperaturedependent NIR spectra
changes of liquid octanoic
acid collected in a
temperature range of
15–90 °C. Reproduced from
Ref. [13] with permission
group emerges. It is noted that the intensity of a band at 6920 cm
−1 increases as a
function of temperature, while those of other bands in the 7300–7000 cm
−1 region
are almost temperature independent. Thus, the band at 6920 cm
−1 is assigned to the
first overtone of the OH stretching mode of the monomeric species of octanoic acid,
and the rest is due to combinations of CH vibrations [13].
The spectra of Figs. 4.2 and 4.3 are also good examples of perturbation-dependent
spectra changes.
(6) Comparison of an NIR spectrum with the corresponding IR spectrum
The significance of comparison of an NIR spectrum with the corresponding IR spectrum was pointed out in Chap. 2.1.6. Here, let us compare NIR spectra of poly(3hydroxybutyrate) (PHB) with the corresponding IR spectra again but this time in a
different region. Figure 4.7a shows time-dependent changes in the NIR spectra in
the 5200–5060 cm
−1 region of a PHB film during the melt-crystallization process
at 125 °C [14]. The corresponding IR spectra in the region of 1780–1670 cm
−1 are
depicted in Fig. 4.7b [14]. Of note is that a band at 5127 cm
−1 in the NIR spectra
gradually increases during the crystallization process, while a broad feature centered
at 5160 cm
−1 decreases with time, suggesting that the former band is assigned to the
crystalline band and the latter band to the amorphous one. In the corresponding IR
spectra bands at 1722 and 1743 cm
−1 are ascribed to the crystalline and amorphous
C=O bands, respectively. Of note is that the NIR spectra and the IR spectra show
very clear correspondence. The comparison of the NIR spectra with the IR spectra
led Hu et al. [14] to ascribe the band at 5127 cm
−1 to the second overtone of the C=O
stretching mode of the C–H…O=C hydrogen bonding in the crystalline state and the
broad feature near 5160 cm
−1 to the corresponding band due to the amorphous state.
Figure 4.8a, b gives rise to another example of comparison between a NIR spectrum and an IR spectrum. They are the IR spectrum in the 3800–3000 cm
−1 region
and the NIR spectrum in the 7600–6000 cm
−1 region of diluted methanol in CCl 4 .
A peak at 3630 cm
−1 and that at 7090 cm
−1 are due to a fundamental and a first
overtone of a stretching mode of free OH group of methanol while broad features in
the regions of 3500–3200 and 6900–6100 cm
−1 arise from a fundamental and a first
overtone of a stretching mode of hydrogen-bonded OH groups of methanol dimer,
trimer, and oligomers. Thus, there is the correspondence between the NIR spectrum