

4 Spectral Analysis in the NIR Spectroscopy
67
subtracting the spectrum of sample a from that of sample b. The calculation of
difference spectra is effective to analyze perturbation-dependent NIR spectra such
as temperature-dependent, concentration-dependent, and pH-dependent spectra. To
calculate accurate difference spectra one must obtain spectra with very high wavelength accuracy. Let us show very simple but important example of the calculation
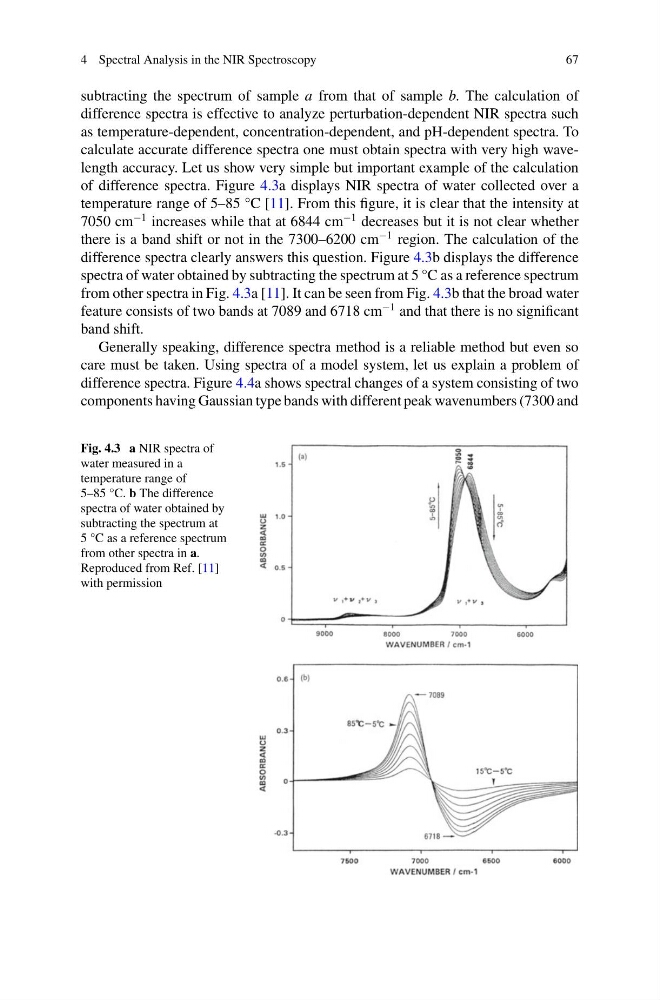
of difference spectra. Figure 4.3a displays NIR spectra of water collected over a
temperature range of 5–85 °C [11]. From this figure, it is clear that the intensity at
7050 cm
−1 increases while that at 6844 cm
−1 decreases but it is not clear whether
there is a band shift or not in the 7300–6200 cm
−1 region. The calculation of the
difference spectra clearly answers this question. Figure 4.3b displays the difference
spectra of water obtained by subtracting the spectrum at 5 °C as a reference spectrum
from other spectra in Fig. 4.3a [11]. It can be seen from Fig. 4.3b that the broad water
feature consists of two bands at 7089 and 6718 cm
−1 and that there is no significant
band shift.
Generally speaking, difference spectra method is a reliable method but even so
care must be taken. Using spectra of a model system, let us explain a problem of
difference spectra. Figure 4.4a shows spectral changes of a system consisting of two
components having Gaussian type bands with different peak wavenumbers (7300 and
Fig. 4.3 a NIR spectra of
water measured in a
temperature range of
5–85 °C. b The difference
spectra of water obtained by
subtracting the spectrum at
5 °C as a reference spectrum
from other spectra in a.
Reproduced from Ref. [11]
with permission
67
subtracting the spectrum of sample a from that of sample b. The calculation of
difference spectra is effective to analyze perturbation-dependent NIR spectra such
as temperature-dependent, concentration-dependent, and pH-dependent spectra. To
calculate accurate difference spectra one must obtain spectra with very high wavelength accuracy. Let us show very simple but important example of the calculation
of difference spectra. Figure 4.3a displays NIR spectra of water collected over a
temperature range of 5–85 °C [11]. From this figure, it is clear that the intensity at
7050 cm
−1 increases while that at 6844 cm
−1 decreases but it is not clear whether
there is a band shift or not in the 7300–6200 cm
−1 region. The calculation of the
difference spectra clearly answers this question. Figure 4.3b displays the difference
spectra of water obtained by subtracting the spectrum at 5 °C as a reference spectrum
from other spectra in Fig. 4.3a [11]. It can be seen from Fig. 4.3b that the broad water
feature consists of two bands at 7089 and 6718 cm
−1 and that there is no significant
band shift.
Generally speaking, difference spectra method is a reliable method but even so
care must be taken. Using spectra of a model system, let us explain a problem of
difference spectra. Figure 4.4a shows spectral changes of a system consisting of two
components having Gaussian type bands with different peak wavenumbers (7300 and
Fig. 4.3 a NIR spectra of
water measured in a
temperature range of
5–85 °C. b The difference
spectra of water obtained by
subtracting the spectrum at
5 °C as a reference spectrum
from other spectra in a.
Reproduced from Ref. [11]
with permission