

21 Applications of NIR Techniques in Polymer Coatings …
511
1400
1500
1600
1700
1800
1900
0.0
0.2
0.4
0.6
0.8
1.0
Reflectance (normalized)
Wavelength [nm]
without Web
1 Web
2 Webs
3 Webs
4 Webs
Increasing Number
of Webs
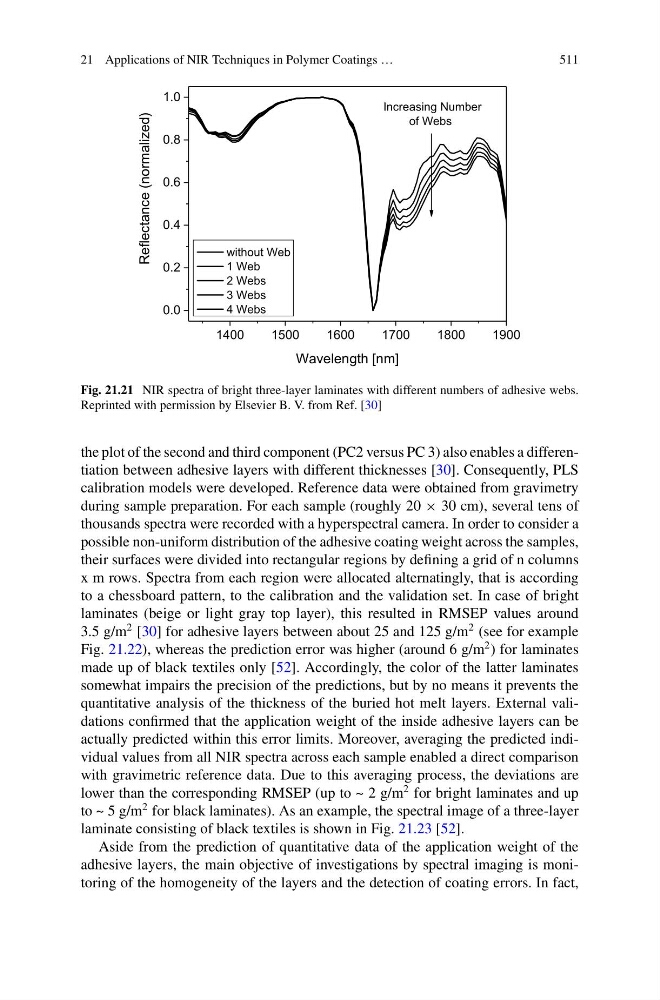
Fig. 21.21 NIR spectra of bright three-layer laminates with different numbers of adhesive webs.
Reprinted with permission by Elsevier B. V. from Ref. [30]
the plot of the second and third component (PC2 versus PC 3) also enables a differentiation between adhesive layers with different thicknesses [30]. Consequently, PLS
calibration models were developed. Reference data were obtained from gravimetry
during sample preparation. For each sample (roughly 20 × 30 cm), several tens of
thousands spectra were recorded with a hyperspectral camera. In order to consider a
possible non-uniform distribution of the adhesive coating weight across the samples,
their surfaces were divided into rectangular regions by defining a grid of n columns
x m rows. Spectra from each region were allocated alternatingly, that is according
to a chessboard pattern, to the calibration and the validation set. In case of bright
laminates (beige or light gray top layer), this resulted in RMSEP values around
3.5 g/m
2 [30] for adhesive layers between about 25 and 125 g/m
2 (see for example
Fig. 21.22), whereas the prediction error was higher (around 6 g/m
2 ) for laminates
made up of black textiles only [52]. Accordingly, the color of the latter laminates
somewhat impairs the precision of the predictions, but by no means it prevents the
quantitative analysis of the thickness of the buried hot melt layers. External validations confirmed that the application weight of the inside adhesive layers can be
actually predicted within this error limits. Moreover, averaging the predicted individual values from all NIR spectra across each sample enabled a direct comparison
with gravimetric reference data. Due to this averaging process, the deviations are
lower than the corresponding RMSEP (up to ~ 2 g/m
2 for bright laminates and up
to ~ 5 g/m
2 for black laminates). As an example, the spectral image of a three-layer
laminate consisting of black textiles is shown in Fig. 21.23 [52].
Aside from the prediction of quantitative data of the application weight of the
adhesive layers, the main objective of investigations by spectral imaging is monitoring of the homogeneity of the layers and the detection of coating errors. In fact,
511
1400
1500
1600
1700
1800
1900
0.0
0.2
0.4
0.6
0.8
1.0
Reflectance (normalized)
Wavelength [nm]
without Web
1 Web
2 Webs
3 Webs
4 Webs
Increasing Number
of Webs
Fig. 21.21 NIR spectra of bright three-layer laminates with different numbers of adhesive webs.
Reprinted with permission by Elsevier B. V. from Ref. [30]
the plot of the second and third component (PC2 versus PC 3) also enables a differentiation between adhesive layers with different thicknesses [30]. Consequently, PLS
calibration models were developed. Reference data were obtained from gravimetry
during sample preparation. For each sample (roughly 20 × 30 cm), several tens of
thousands spectra were recorded with a hyperspectral camera. In order to consider a
possible non-uniform distribution of the adhesive coating weight across the samples,
their surfaces were divided into rectangular regions by defining a grid of n columns
x m rows. Spectra from each region were allocated alternatingly, that is according
to a chessboard pattern, to the calibration and the validation set. In case of bright
laminates (beige or light gray top layer), this resulted in RMSEP values around
3.5 g/m
2 [30] for adhesive layers between about 25 and 125 g/m
2 (see for example
Fig. 21.22), whereas the prediction error was higher (around 6 g/m
2 ) for laminates
made up of black textiles only [52]. Accordingly, the color of the latter laminates
somewhat impairs the precision of the predictions, but by no means it prevents the
quantitative analysis of the thickness of the buried hot melt layers. External validations confirmed that the application weight of the inside adhesive layers can be
actually predicted within this error limits. Moreover, averaging the predicted individual values from all NIR spectra across each sample enabled a direct comparison
with gravimetric reference data. Due to this averaging process, the deviations are
lower than the corresponding RMSEP (up to ~ 2 g/m
2 for bright laminates and up
to ~ 5 g/m
2 for black laminates). As an example, the spectral image of a three-layer
laminate consisting of black textiles is shown in Fig. 21.23 [52].
Aside from the prediction of quantitative data of the application weight of the
adhesive layers, the main objective of investigations by spectral imaging is monitoring of the homogeneity of the layers and the detection of coating errors. In fact,