

21 Applications of NIR Techniques in Polymer Coatings …
507
0
10
20
30
40
50
60
0
20
40
60
Factors 3
RMSEE 1.8 g m
-2
Bias
-0.01 g m
-2
SEC
1.8 g m
-2
RMSEP 2.1 g m
-2
Bias
0.5 g m
-2
SEP
2.0 g m
-2
R²
98.7 %
r²
0.993
Predicted Application Weight [g m
-2
]
Gravimetric Application Weight [g m
-2 ]
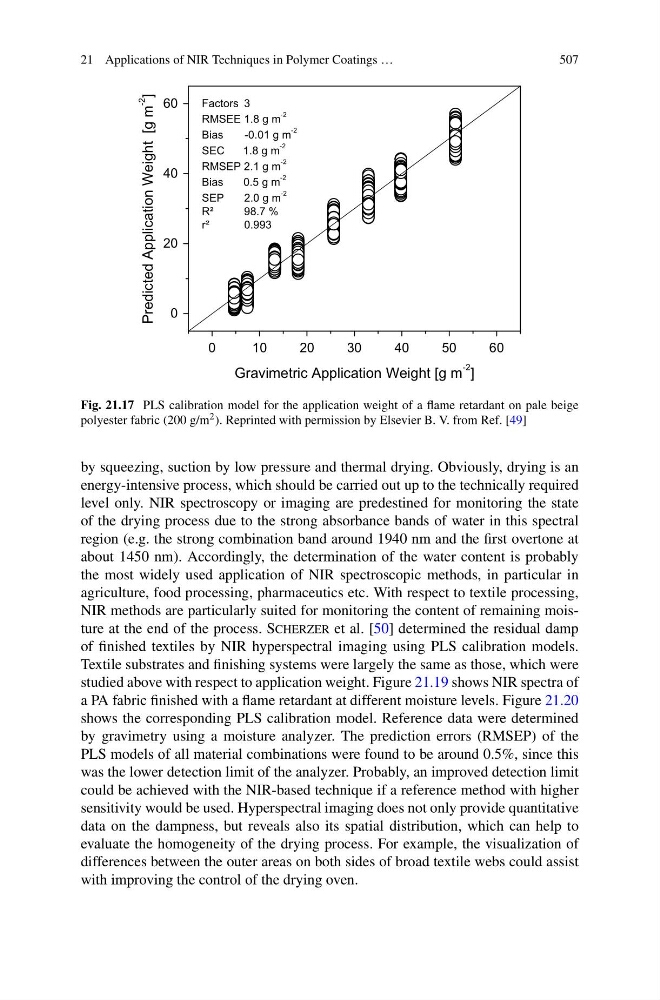
Fig. 21.17 PLS calibration model for the application weight of a flame retardant on pale beige
polyester fabric (200 g/m 2 ). Reprinted with permission by Elsevier B. V. from Ref. [49]
by squeezing, suction by low pressure and thermal drying. Obviously, drying is an
energy-intensive process, which should be carried out up to the technically required
level only. NIR spectroscopy or imaging are predestined for monitoring the state
of the drying process due to the strong absorbance bands of water in this spectral
region (e.g. the strong combination band around 1940 nm and the first overtone at
about 1450 nm). Accordingly, the determination of the water content is probably
the most widely used application of NIR spectroscopic methods, in particular in
agriculture, food processing, pharmaceutics etc. With respect to textile processing,
NIR methods are particularly suited for monitoring the content of remaining moisture at the end of the process. Scherzer et al. [50] determined the residual damp
of finished textiles by NIR hyperspectral imaging using PLS calibration models.
Textile substrates and finishing systems were largely the same as those, which were
studied above with respect to application weight. Figure 21.19 shows NIR spectra of
a PA fabric finished with a flame retardant at different moisture levels. Figure 21.20
shows the corresponding PLS calibration model. Reference data were determined
by gravimetry using a moisture analyzer. The prediction errors (RMSEP) of the
PLS models of all material combinations were found to be around 0.5%, since this
was the lower detection limit of the analyzer. Probably, an improved detection limit
could be achieved with the NIR-based technique if a reference method with higher
sensitivity would be used. Hyperspectral imaging does not only provide quantitative
data on the dampness, but reveals also its spatial distribution, which can help to
evaluate the homogeneity of the drying process. For example, the visualization of
differences between the outer areas on both sides of broad textile webs could assist
with improving the control of the drying oven.
507
0
10
20
30
40
50
60
0
20
40
60
Factors 3
RMSEE 1.8 g m
-2
Bias
-0.01 g m
-2
SEC
1.8 g m
-2
RMSEP 2.1 g m
-2
Bias
0.5 g m
-2
SEP
2.0 g m
-2
R²
98.7 %
r²
0.993
Predicted Application Weight [g m
-2
]
Gravimetric Application Weight [g m
-2 ]
Fig. 21.17 PLS calibration model for the application weight of a flame retardant on pale beige
polyester fabric (200 g/m 2 ). Reprinted with permission by Elsevier B. V. from Ref. [49]
by squeezing, suction by low pressure and thermal drying. Obviously, drying is an
energy-intensive process, which should be carried out up to the technically required
level only. NIR spectroscopy or imaging are predestined for monitoring the state
of the drying process due to the strong absorbance bands of water in this spectral
region (e.g. the strong combination band around 1940 nm and the first overtone at
about 1450 nm). Accordingly, the determination of the water content is probably
the most widely used application of NIR spectroscopic methods, in particular in
agriculture, food processing, pharmaceutics etc. With respect to textile processing,
NIR methods are particularly suited for monitoring the content of remaining moisture at the end of the process. Scherzer et al. [50] determined the residual damp
of finished textiles by NIR hyperspectral imaging using PLS calibration models.
Textile substrates and finishing systems were largely the same as those, which were
studied above with respect to application weight. Figure 21.19 shows NIR spectra of
a PA fabric finished with a flame retardant at different moisture levels. Figure 21.20
shows the corresponding PLS calibration model. Reference data were determined
by gravimetry using a moisture analyzer. The prediction errors (RMSEP) of the
PLS models of all material combinations were found to be around 0.5%, since this
was the lower detection limit of the analyzer. Probably, an improved detection limit
could be achieved with the NIR-based technique if a reference method with higher
sensitivity would be used. Hyperspectral imaging does not only provide quantitative
data on the dampness, but reveals also its spatial distribution, which can help to
evaluate the homogeneity of the drying process. For example, the visualization of
differences between the outer areas on both sides of broad textile webs could assist
with improving the control of the drying oven.