

21 Applications of NIR Techniques in Polymer Coatings …
503
e.g. in technical applications (e.g. fire resistance, wear resistance) strongly depend
on the ratio of the components [43]. Conventional analytic standard methods are
time-consuming, labor-intensive and might require harmful chemicals (e.g. H 2 SO 4
solution). NIR spectroscopy has been proven to be a powerful tool for the quantitative
analysis of textile blends [38, 43–46]. The prediction of the content of the individual
materials in such blends is often difficult due to the complex influence of a multiplicity of chemical, physical and textile parameters. Therefore, very large sample
sets (e.g. about 200–300 cotton/PET samples [44–46]) are required for calibration
of the models, which span not only the complete range of blend compositions (0–
100% of each component), but also cover the variability of all other parameters. The
immense data volume requires advanced mathematical pretreatment of the spectra
as well genetic algorithms [44, 45] for variable selection in order to reduce the
complexity of the multivariate models. Quantitative analysis itself is often based on
the PLS regression. Moreover, support vector machine models have been tested [46].
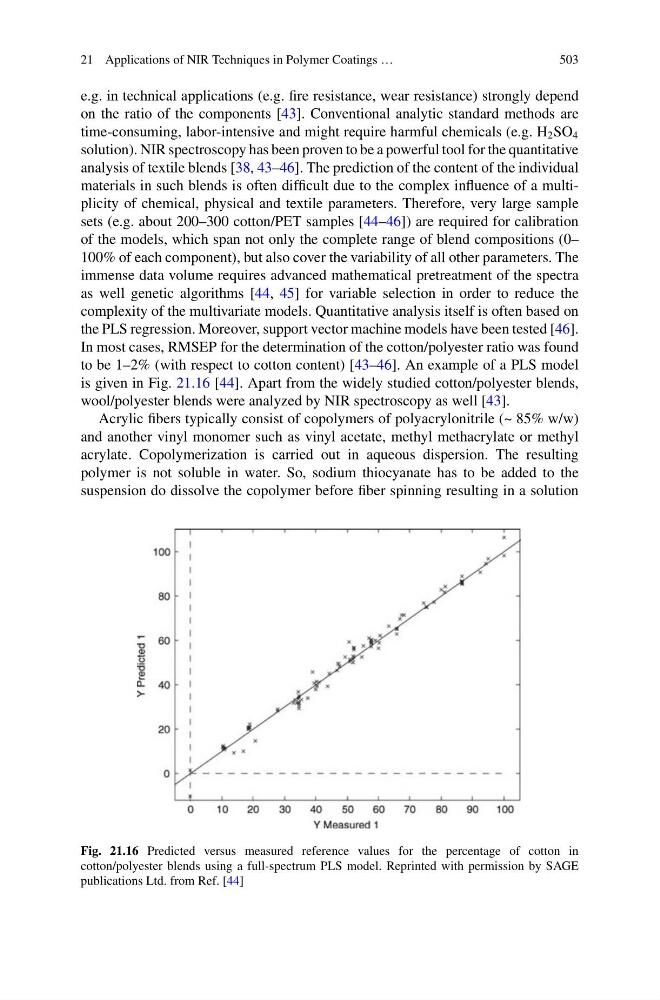
In most cases, RMSEP for the determination of the cotton/polyester ratio was found
to be 1–2% (with respect to cotton content) [43–46]. An example of a PLS model
is given in Fig. 21.16 [44]. Apart from the widely studied cotton/polyester blends,
wool/polyester blends were analyzed by NIR spectroscopy as well [43].
Acrylic fibers typically consist of copolymers of polyacrylonitrile (~ 85% w/w)
and another vinyl monomer such as vinyl acetate, methyl methacrylate or methyl
acrylate. Copolymerization is carried out in aqueous dispersion. The resulting
polymer is not soluble in water. So, sodium thiocyanate has to be added to the
suspension do dissolve the copolymer before fiber spinning resulting in a solution
Fig. 21.16 Predicted versus measured reference values for the percentage of cotton in
cotton/polyester blends using a full-spectrum PLS model. Reprinted with permission by SAGE
publications Ltd. from Ref. [44]
503
e.g. in technical applications (e.g. fire resistance, wear resistance) strongly depend
on the ratio of the components [43]. Conventional analytic standard methods are
time-consuming, labor-intensive and might require harmful chemicals (e.g. H 2 SO 4
solution). NIR spectroscopy has been proven to be a powerful tool for the quantitative
analysis of textile blends [38, 43–46]. The prediction of the content of the individual
materials in such blends is often difficult due to the complex influence of a multiplicity of chemical, physical and textile parameters. Therefore, very large sample
sets (e.g. about 200–300 cotton/PET samples [44–46]) are required for calibration
of the models, which span not only the complete range of blend compositions (0–
100% of each component), but also cover the variability of all other parameters. The
immense data volume requires advanced mathematical pretreatment of the spectra
as well genetic algorithms [44, 45] for variable selection in order to reduce the
complexity of the multivariate models. Quantitative analysis itself is often based on
the PLS regression. Moreover, support vector machine models have been tested [46].
In most cases, RMSEP for the determination of the cotton/polyester ratio was found
to be 1–2% (with respect to cotton content) [43–46]. An example of a PLS model
is given in Fig. 21.16 [44]. Apart from the widely studied cotton/polyester blends,
wool/polyester blends were analyzed by NIR spectroscopy as well [43].
Acrylic fibers typically consist of copolymers of polyacrylonitrile (~ 85% w/w)
and another vinyl monomer such as vinyl acetate, methyl methacrylate or methyl
acrylate. Copolymerization is carried out in aqueous dispersion. The resulting
polymer is not soluble in water. So, sodium thiocyanate has to be added to the
suspension do dissolve the copolymer before fiber spinning resulting in a solution
Fig. 21.16 Predicted versus measured reference values for the percentage of cotton in
cotton/polyester blends using a full-spectrum PLS model. Reprinted with permission by SAGE
publications Ltd. from Ref. [44]