

20 Medical Applications of NIR Spectroscopy
445
Table 20.1 Analytical cross-validation results for blood plasma compounds obtained from PLS
calibration models based on different spectral ranges and logarithmized single beam data (same
plasma sample population from 124 patients) [8]
Analyte
Standard error of prediction
SW-NIR a
NIR b
MIR c
Units
Total protein
1.08
1.07
0.90
g l −1
Total cholesterol
15.4
7.7
8.2
mg dl −1
Triglycerides
23.4
12.1
10.3
mg dl −1
Glucose
47.3
16.2
9.8
mg dl −1
Urea
–
4.7
2.6
mg dl −1
a Spectral calibration interval for all substrates 11,015–7620 cm −1 ; transmission cell of 10 mm
pathlength
b Spectral range for protein 6000–5510 cm −1 , for cholesterol and triglycerides with additional
interval of 4520–4212 cm −1 , for glucose and urea 6790–5460 and 4735–4210 cm −1 ; transmission
cell of 1 mm pathlength
c Spectral range for protein 1700–1350 cm −1 , for cholesterol 3000–2800, 1800–1700 and 1500–
1100 cm −1 , for triglycerides same intervals except the upper one, for glucose 1200–950 cm −1 , and
urea 1800–1130 cm −1 ; ATR micro-circle cell
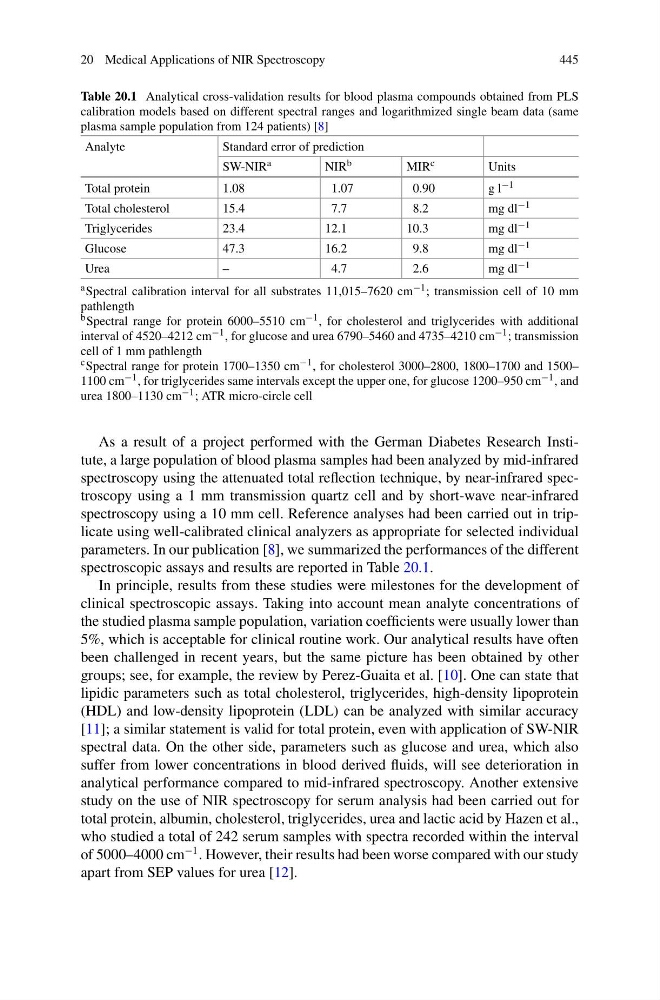
As a result of a project performed with the German Diabetes Research Institute, a large population of blood plasma samples had been analyzed by mid-infrared
spectroscopy using the attenuated total reflection technique, by near-infrared spectroscopy using a 1 mm transmission quartz cell and by short-wave near-infrared
spectroscopy using a 10 mm cell. Reference analyses had been carried out in triplicate using well-calibrated clinical analyzers as appropriate for selected individual
parameters. In our publication [8], we summarized the performances of the different
spectroscopic assays and results are reported in Table 20.1.
In principle, results from these studies were milestones for the development of
clinical spectroscopic assays. Taking into account mean analyte concentrations of
the studied plasma sample population, variation coefficients were usually lower than
5%, which is acceptable for clinical routine work. Our analytical results have often
been challenged in recent years, but the same picture has been obtained by other
groups; see, for example, the review by Perez-Guaita et al. [10]. One can state that
lipidic parameters such as total cholesterol, triglycerides, high-density lipoprotein
(HDL) and low-density lipoprotein (LDL) can be analyzed with similar accuracy
[11]; a similar statement is valid for total protein, even with application of SW-NIR
spectral data. On the other side, parameters such as glucose and urea, which also
suffer from lower concentrations in blood derived fluids, will see deterioration in
analytical performance compared to mid-infrared spectroscopy. Another extensive
study on the use of NIR spectroscopy for serum analysis had been carried out for
total protein, albumin, cholesterol, triglycerides, urea and lactic acid by Hazen et al.,
who studied a total of 242 serum samples with spectra recorded within the interval
of 5000–4000 cm
−1 . However, their results had been worse compared with our study
apart from SEP values for urea [12].
445
Table 20.1 Analytical cross-validation results for blood plasma compounds obtained from PLS
calibration models based on different spectral ranges and logarithmized single beam data (same
plasma sample population from 124 patients) [8]
Analyte
Standard error of prediction
SW-NIR a
NIR b
MIR c
Units
Total protein
1.08
1.07
0.90
g l −1
Total cholesterol
15.4
7.7
8.2
mg dl −1
Triglycerides
23.4
12.1
10.3
mg dl −1
Glucose
47.3
16.2
9.8
mg dl −1
Urea
–
4.7
2.6
mg dl −1
a Spectral calibration interval for all substrates 11,015–7620 cm −1 ; transmission cell of 10 mm
pathlength
b Spectral range for protein 6000–5510 cm −1 , for cholesterol and triglycerides with additional
interval of 4520–4212 cm −1 , for glucose and urea 6790–5460 and 4735–4210 cm −1 ; transmission
cell of 1 mm pathlength
c Spectral range for protein 1700–1350 cm −1 , for cholesterol 3000–2800, 1800–1700 and 1500–
1100 cm −1 , for triglycerides same intervals except the upper one, for glucose 1200–950 cm −1 , and
urea 1800–1130 cm −1 ; ATR micro-circle cell
As a result of a project performed with the German Diabetes Research Institute, a large population of blood plasma samples had been analyzed by mid-infrared
spectroscopy using the attenuated total reflection technique, by near-infrared spectroscopy using a 1 mm transmission quartz cell and by short-wave near-infrared
spectroscopy using a 10 mm cell. Reference analyses had been carried out in triplicate using well-calibrated clinical analyzers as appropriate for selected individual
parameters. In our publication [8], we summarized the performances of the different
spectroscopic assays and results are reported in Table 20.1.
In principle, results from these studies were milestones for the development of
clinical spectroscopic assays. Taking into account mean analyte concentrations of
the studied plasma sample population, variation coefficients were usually lower than
5%, which is acceptable for clinical routine work. Our analytical results have often
been challenged in recent years, but the same picture has been obtained by other
groups; see, for example, the review by Perez-Guaita et al. [10]. One can state that
lipidic parameters such as total cholesterol, triglycerides, high-density lipoprotein
(HDL) and low-density lipoprotein (LDL) can be analyzed with similar accuracy
[11]; a similar statement is valid for total protein, even with application of SW-NIR
spectral data. On the other side, parameters such as glucose and urea, which also
suffer from lower concentrations in blood derived fluids, will see deterioration in
analytical performance compared to mid-infrared spectroscopy. Another extensive
study on the use of NIR spectroscopy for serum analysis had been carried out for
total protein, albumin, cholesterol, triglycerides, urea and lactic acid by Hazen et al.,
who studied a total of 242 serum samples with spectra recorded within the interval
of 5000–4000 cm
−1 . However, their results had been worse compared with our study
apart from SEP values for urea [12].