

18 Near-Infrared Spectroscopy in the Pharmaceutical Industry
395
on Pichia pastoris. The monitoring of product, methanol, glycerol, and biomass
using both transmittance and reflectance (when sample was too optically dense) NIR
spectroscopic modes was demonstrated [20]. On-line monitoring through a recirculation loop showed the ability to monitor methanol and developing feed-back control
to maintain its level at various set points [21]. In-line monitoring of a fermentation
process with Streptomyces coelicolor was published for the prediction of glucose and
ammonium using a fiber-based system. Authors compared the results with off-line
samples and showed that signal attenuation above 2000 nm resulted in lower quality
models for ammonium [22]. Further in-line examples of fermentation monitoring
demonstrated prediction errors relevant for considering the reduction or elimination
of manual sampling while maintaining a higher level of process monitoring, control,
and fault detection [23].
Fermentations are progressively being replaced by mammalian cell-based bioreactors such as the Chinese Hamster Ovary (CHO) cells for the production of complex
monoclonal antibodies. For mammalian cell reactors, the monitoring of glucose,
lactate, and ammonia has been investigated [24, 25].
An example of deployment of several transflectance probes using a multiplexed
FT-NIR spectrometer was published. Author monitored 12,500 L bioreactors using
partial least-squares (PLS) regression models for seven parameters: glucose concentration, osmolality, packed cell volume, product titer, viable cell density, integrated
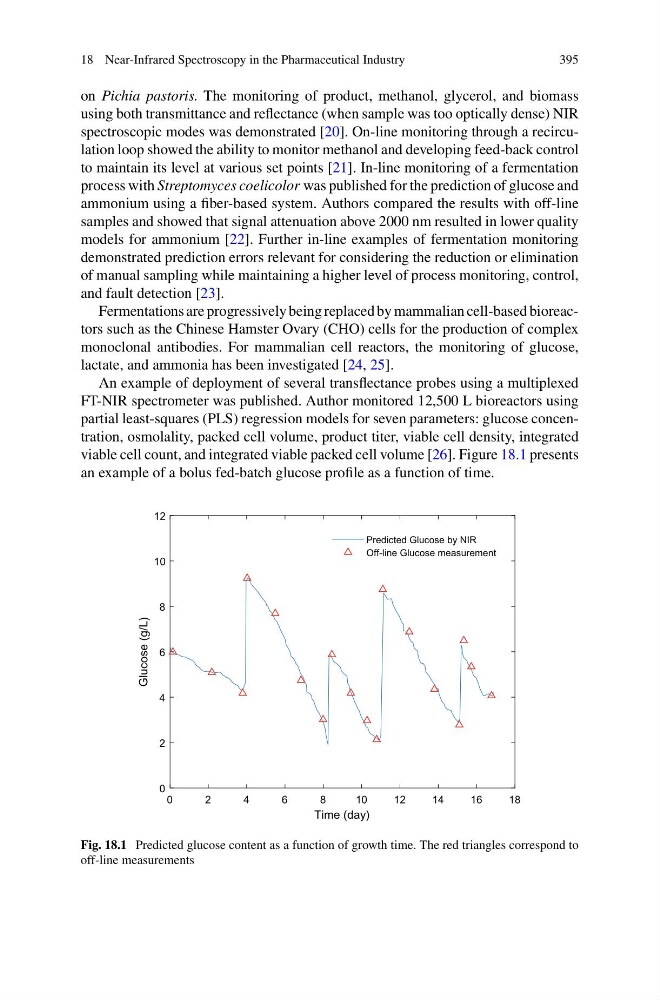
viable cell count, and integrated viable packed cell volume [26]. Figure 18.1 presents
an example of a bolus fed-batch glucose profile as a function of time.
0
2
4
6
8
1 0
1 2
1 4
1 6
1 8
Time (day)
0
2
4
6
8
10
12
Glucose (g/L)
Predicted Glucose by NIR
Off-line Glucose measurement
Fig. 18.1 Predicted glucose content as a function of growth time. The red triangles correspond to
off-line measurements
395
on Pichia pastoris. The monitoring of product, methanol, glycerol, and biomass
using both transmittance and reflectance (when sample was too optically dense) NIR
spectroscopic modes was demonstrated [20]. On-line monitoring through a recirculation loop showed the ability to monitor methanol and developing feed-back control
to maintain its level at various set points [21]. In-line monitoring of a fermentation
process with Streptomyces coelicolor was published for the prediction of glucose and
ammonium using a fiber-based system. Authors compared the results with off-line
samples and showed that signal attenuation above 2000 nm resulted in lower quality
models for ammonium [22]. Further in-line examples of fermentation monitoring
demonstrated prediction errors relevant for considering the reduction or elimination
of manual sampling while maintaining a higher level of process monitoring, control,
and fault detection [23].
Fermentations are progressively being replaced by mammalian cell-based bioreactors such as the Chinese Hamster Ovary (CHO) cells for the production of complex
monoclonal antibodies. For mammalian cell reactors, the monitoring of glucose,
lactate, and ammonia has been investigated [24, 25].
An example of deployment of several transflectance probes using a multiplexed
FT-NIR spectrometer was published. Author monitored 12,500 L bioreactors using
partial least-squares (PLS) regression models for seven parameters: glucose concentration, osmolality, packed cell volume, product titer, viable cell density, integrated
viable cell count, and integrated viable packed cell volume [26]. Figure 18.1 presents
an example of a bolus fed-batch glucose profile as a function of time.
0
2
4
6
8
1 0
1 2
1 4
1 6
1 8
Time (day)
0
2
4
6
8
10
12
Glucose (g/L)
Predicted Glucose by NIR
Off-line Glucose measurement
Fig. 18.1 Predicted glucose content as a function of growth time. The red triangles correspond to
off-line measurements