

340
B. Vincent and P. Dardenne
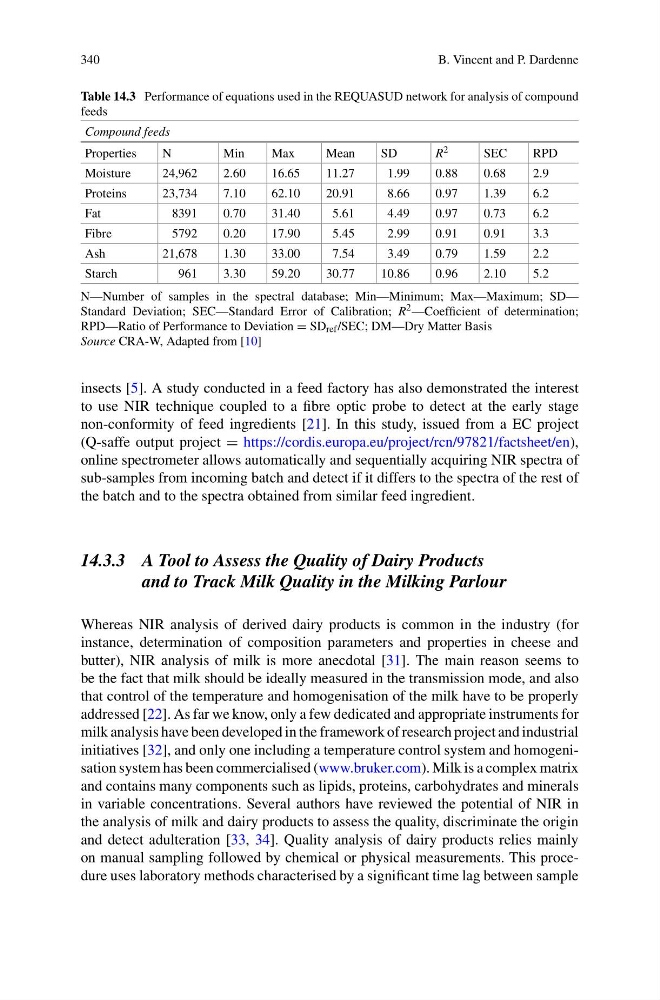
Table 14.3 Performance of equations used in the REQUASUD network for analysis of compound
feeds
Compound feeds
Properties
N
Min
Max
Mean
SD
R 2
SEC
RPD
Moisture
24,962
2.60
16.65
11.27
1.99
0.88
0.68
2.9
Proteins
23,734
7.10
62.10
20.91
8.66
0.97
1.39
6.2
Fat
8391
0.70
31.40
5.61
4.49
0.97
0.73
6.2
Fibre
5792
0.20
17.90
5.45
2.99
0.91
0.91
3.3
Ash
21,678
1.30
33.00
7.54
3.49
0.79
1.59
2.2
Starch
961
3.30
59.20
30.77
10.86
0.96
2.10
5.2
N—Number of samples in the spectral database; Min—Minimum; Max—Maximum; SD—
Standard Deviation; SEC—Standard Error of Calibration; R 2 —Coefficient of determination;
RPD—Ratio of Performance to Deviation = SD ref /SEC; DM—Dry Matter Basis
Source CRA-W, Adapted from [10]
insects [5]. A study conducted in a feed factory has also demonstrated the interest
to use NIR technique coupled to a fibre optic probe to detect at the early stage
non-conformity of feed ingredients [21]. In this study, issued from a EC project
(Q-saffe output project = https://cordis.europa.eu/project/rcn/97821/factsheet/en),
online spectrometer allows automatically and sequentially acquiring NIR spectra of
sub-samples from incoming batch and detect if it differs to the spectra of the rest of
the batch and to the spectra obtained from similar feed ingredient.
14.3.3 A Tool to Assess the Quality of Dairy Products
and to Track Milk Quality in the Milking Parlour
Whereas NIR analysis of derived dairy products is common in the industry (for
instance, determination of composition parameters and properties in cheese and
butter), NIR analysis of milk is more anecdotal [31]. The main reason seems to
be the fact that milk should be ideally measured in the transmission mode, and also
that control of the temperature and homogenisation of the milk have to be properly
addressed [22]. As far we know, only a few dedicated and appropriate instruments for
milk analysis have been developed in the framework of research project and industrial
initiatives [32], and only one including a temperature control system and homogenisation system has been commercialised (www.bruker.com). Milk is a complex matrix
and contains many components such as lipids, proteins, carbohydrates and minerals
in variable concentrations. Several authors have reviewed the potential of NIR in
the analysis of milk and dairy products to assess the quality, discriminate the origin
and detect adulteration [33, 34]. Quality analysis of dairy products relies mainly
on manual sampling followed by chemical or physical measurements. This procedure uses laboratory methods characterised by a significant time lag between sample
B. Vincent and P. Dardenne
Table 14.3 Performance of equations used in the REQUASUD network for analysis of compound
feeds
Compound feeds
Properties
N
Min
Max
Mean
SD
R 2
SEC
RPD
Moisture
24,962
2.60
16.65
11.27
1.99
0.88
0.68
2.9
Proteins
23,734
7.10
62.10
20.91
8.66
0.97
1.39
6.2
Fat
8391
0.70
31.40
5.61
4.49
0.97
0.73
6.2
Fibre
5792
0.20
17.90
5.45
2.99
0.91
0.91
3.3
Ash
21,678
1.30
33.00
7.54
3.49
0.79
1.59
2.2
Starch
961
3.30
59.20
30.77
10.86
0.96
2.10
5.2
N—Number of samples in the spectral database; Min—Minimum; Max—Maximum; SD—
Standard Deviation; SEC—Standard Error of Calibration; R 2 —Coefficient of determination;
RPD—Ratio of Performance to Deviation = SD ref /SEC; DM—Dry Matter Basis
Source CRA-W, Adapted from [10]
insects [5]. A study conducted in a feed factory has also demonstrated the interest
to use NIR technique coupled to a fibre optic probe to detect at the early stage
non-conformity of feed ingredients [21]. In this study, issued from a EC project
(Q-saffe output project = https://cordis.europa.eu/project/rcn/97821/factsheet/en),
online spectrometer allows automatically and sequentially acquiring NIR spectra of
sub-samples from incoming batch and detect if it differs to the spectra of the rest of
the batch and to the spectra obtained from similar feed ingredient.
14.3.3 A Tool to Assess the Quality of Dairy Products
and to Track Milk Quality in the Milking Parlour
Whereas NIR analysis of derived dairy products is common in the industry (for
instance, determination of composition parameters and properties in cheese and
butter), NIR analysis of milk is more anecdotal [31]. The main reason seems to
be the fact that milk should be ideally measured in the transmission mode, and also
that control of the temperature and homogenisation of the milk have to be properly
addressed [22]. As far we know, only a few dedicated and appropriate instruments for
milk analysis have been developed in the framework of research project and industrial
initiatives [32], and only one including a temperature control system and homogenisation system has been commercialised (www.bruker.com). Milk is a complex matrix
and contains many components such as lipids, proteins, carbohydrates and minerals
in variable concentrations. Several authors have reviewed the potential of NIR in
the analysis of milk and dairy products to assess the quality, discriminate the origin
and detect adulteration [33, 34]. Quality analysis of dairy products relies mainly
on manual sampling followed by chemical or physical measurements. This procedure uses laboratory methods characterised by a significant time lag between sample