

334
B. Vincent and P. Dardenne
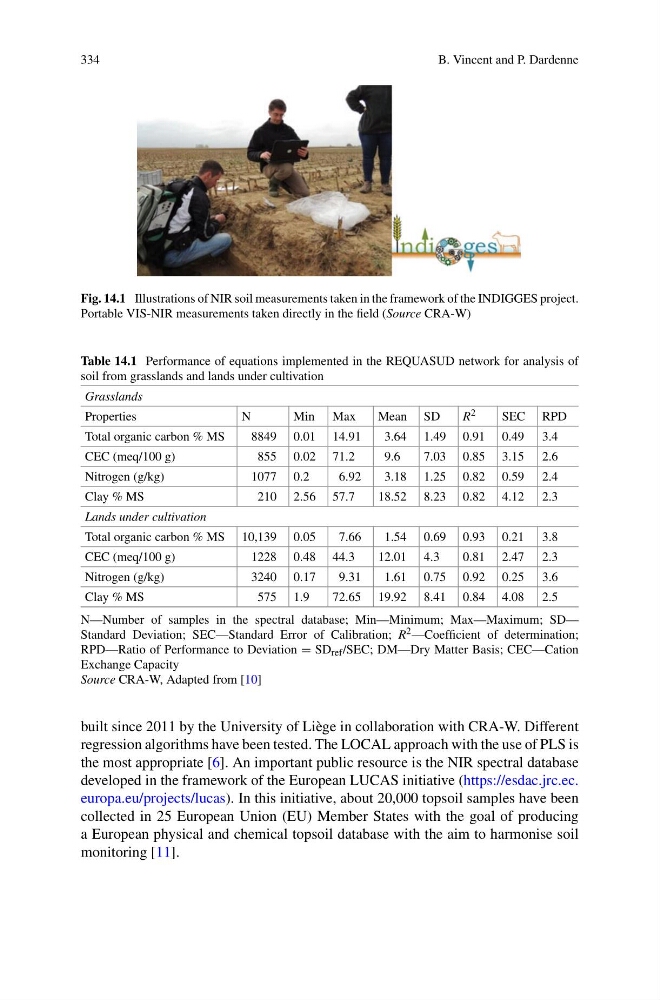
Fig. 14.1 Illustrations of NIR soil measurements taken in the framework of the INDIGGES project.
Portable VIS-NIR measurements taken directly in the field (Source CRA-W)
Table 14.1 Performance of equations implemented in the REQUASUD network for analysis of
soil from grasslands and lands under cultivation
Grasslands
Properties
N
Min Max
Mean SD
R 2
SEC RPD
Total organic carbon % MS
8849 0.01 14.91
3.64 1.49 0.91 0.49 3.4
CEC (meq/100 g)
855 0.02 71.2
9.6
7.03 0.85 3.15 2.6
Nitrogen (g/kg)
1077 0.2
6.92
3.18 1.25 0.82 0.59 2.4
Clay % MS
210 2.56 57.7
18.52 8.23 0.82 4.12 2.3
Lands under cultivation
Total organic carbon % MS 10,139 0.05
7.66
1.54 0.69 0.93 0.21 3.8
CEC (meq/100 g)
1228 0.48 44.3
12.01 4.3
0.81 2.47 2.3
Nitrogen (g/kg)
3240 0.17
9.31
1.61 0.75 0.92 0.25 3.6
Clay % MS
575 1.9
72.65 19.92 8.41 0.84 4.08 2.5
N—Number of samples in the spectral database; Min—Minimum; Max—Maximum; SD—
Standard Deviation; SEC—Standard Error of Calibration; R 2 —Coefficient of determination;
RPD—Ratio of Performance to Deviation = SD ref /SEC; DM—Dry Matter Basis; CEC—Cation
Exchange Capacity
Source CRA-W, Adapted from [10]
built since 2011 by the University of Liège in collaboration with CRA-W. Different
regression algorithms have been tested. The LOCAL approach with the use of PLS is
the most appropriate [6]. An important public resource is the NIR spectral database
developed in the framework of the European LUCAS initiative (https://esdac.jrc.ec.
europa.eu/projects/lucas). In this initiative, about 20,000 topsoil samples have been
collected in 25 European Union (EU) Member States with the goal of producing
a European physical and chemical topsoil database with the aim to harmonise soil
monitoring [11].
B. Vincent and P. Dardenne
Fig. 14.1 Illustrations of NIR soil measurements taken in the framework of the INDIGGES project.
Portable VIS-NIR measurements taken directly in the field (Source CRA-W)
Table 14.1 Performance of equations implemented in the REQUASUD network for analysis of
soil from grasslands and lands under cultivation
Grasslands
Properties
N
Min Max
Mean SD
R 2
SEC RPD
Total organic carbon % MS
8849 0.01 14.91
3.64 1.49 0.91 0.49 3.4
CEC (meq/100 g)
855 0.02 71.2
9.6
7.03 0.85 3.15 2.6
Nitrogen (g/kg)
1077 0.2
6.92
3.18 1.25 0.82 0.59 2.4
Clay % MS
210 2.56 57.7
18.52 8.23 0.82 4.12 2.3
Lands under cultivation
Total organic carbon % MS 10,139 0.05
7.66
1.54 0.69 0.93 0.21 3.8
CEC (meq/100 g)
1228 0.48 44.3
12.01 4.3
0.81 2.47 2.3
Nitrogen (g/kg)
3240 0.17
9.31
1.61 0.75 0.92 0.25 3.6
Clay % MS
575 1.9
72.65 19.92 8.41 0.84 4.08 2.5
N—Number of samples in the spectral database; Min—Minimum; Max—Maximum; SD—
Standard Deviation; SEC—Standard Error of Calibration; R 2 —Coefficient of determination;
RPD—Ratio of Performance to Deviation = SD ref /SEC; DM—Dry Matter Basis; CEC—Cation
Exchange Capacity
Source CRA-W, Adapted from [10]
built since 2011 by the University of Liège in collaboration with CRA-W. Different
regression algorithms have been tested. The LOCAL approach with the use of PLS is
the most appropriate [6]. An important public resource is the NIR spectral database
developed in the framework of the European LUCAS initiative (https://esdac.jrc.ec.
europa.eu/projects/lucas). In this initiative, about 20,000 topsoil samples have been
collected in 25 European Union (EU) Member States with the goal of producing
a European physical and chemical topsoil database with the aim to harmonise soil
monitoring [11].