

326
M. A. Czarnecki et al.
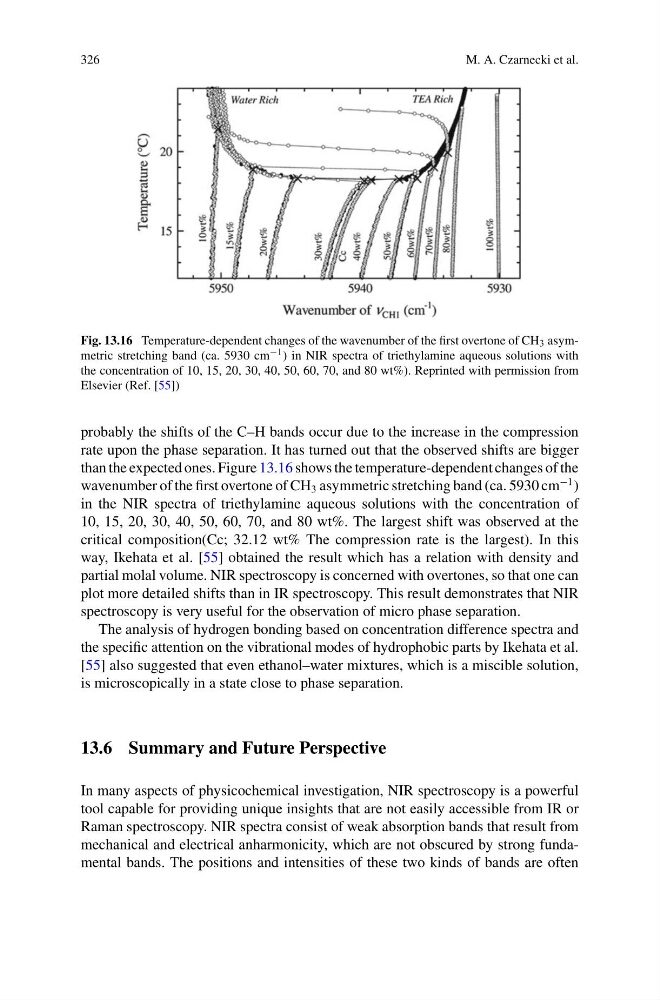
Fig. 13.16 Temperature-dependent changes of the wavenumber of the first overtone of CH 3 asymmetric stretching band (ca. 5930 cm −1 ) in NIR spectra of triethylamine aqueous solutions with
the concentration of 10, 15, 20, 30, 40, 50, 60, 70, and 80 wt%). Reprinted with permission from
Elsevier (Ref. [55])
probably the shifts of the C–H bands occur due to the increase in the compression
rate upon the phase separation. It has turned out that the observed shifts are bigger
than the expected ones. Figure 13.16 shows the temperature-dependent changes of the
wavenumber of the first overtone of CH 3 asymmetric stretching band (ca. 5930 cm
−1 )
in the NIR spectra of triethylamine aqueous solutions with the concentration of
10, 15, 20, 30, 40, 50, 60, 70, and 80 wt%. The largest shift was observed at the
critical composition(Cc; 32.12 wt% The compression rate is the largest). In this
way, Ikehata et al. [55] obtained the result which has a relation with density and
partial molal volume. NIR spectroscopy is concerned with overtones, so that one can
plot more detailed shifts than in IR spectroscopy. This result demonstrates that NIR
spectroscopy is very useful for the observation of micro phase separation.
The analysis of hydrogen bonding based on concentration difference spectra and
the specific attention on the vibrational modes of hydrophobic parts by Ikehata et al.
[55] also suggested that even ethanol–water mixtures, which is a miscible solution,
is microscopically in a state close to phase separation.
13.6 Summary and Future Perspective
In many aspects of physicochemical investigation, NIR spectroscopy is a powerful
tool capable for providing unique insights that are not easily accessible from IR or
Raman spectroscopy. NIR spectra consist of weak absorption bands that result from
mechanical and electrical anharmonicity, which are not obscured by strong fundamental bands. The positions and intensities of these two kinds of bands are often
M. A. Czarnecki et al.
Fig. 13.16 Temperature-dependent changes of the wavenumber of the first overtone of CH 3 asymmetric stretching band (ca. 5930 cm −1 ) in NIR spectra of triethylamine aqueous solutions with
the concentration of 10, 15, 20, 30, 40, 50, 60, 70, and 80 wt%). Reprinted with permission from
Elsevier (Ref. [55])
probably the shifts of the C–H bands occur due to the increase in the compression
rate upon the phase separation. It has turned out that the observed shifts are bigger
than the expected ones. Figure 13.16 shows the temperature-dependent changes of the
wavenumber of the first overtone of CH 3 asymmetric stretching band (ca. 5930 cm
−1 )
in the NIR spectra of triethylamine aqueous solutions with the concentration of
10, 15, 20, 30, 40, 50, 60, 70, and 80 wt%. The largest shift was observed at the
critical composition(Cc; 32.12 wt% The compression rate is the largest). In this
way, Ikehata et al. [55] obtained the result which has a relation with density and
partial molal volume. NIR spectroscopy is concerned with overtones, so that one can
plot more detailed shifts than in IR spectroscopy. This result demonstrates that NIR
spectroscopy is very useful for the observation of micro phase separation.
The analysis of hydrogen bonding based on concentration difference spectra and
the specific attention on the vibrational modes of hydrophobic parts by Ikehata et al.
[55] also suggested that even ethanol–water mixtures, which is a miscible solution,
is microscopically in a state close to phase separation.
13.6 Summary and Future Perspective
In many aspects of physicochemical investigation, NIR spectroscopy is a powerful
tool capable for providing unique insights that are not easily accessible from IR or
Raman spectroscopy. NIR spectra consist of weak absorption bands that result from
mechanical and electrical anharmonicity, which are not obscured by strong fundamental bands. The positions and intensities of these two kinds of bands are often