

13 Overview of Application of NIR Spectroscopy to Physical …
321
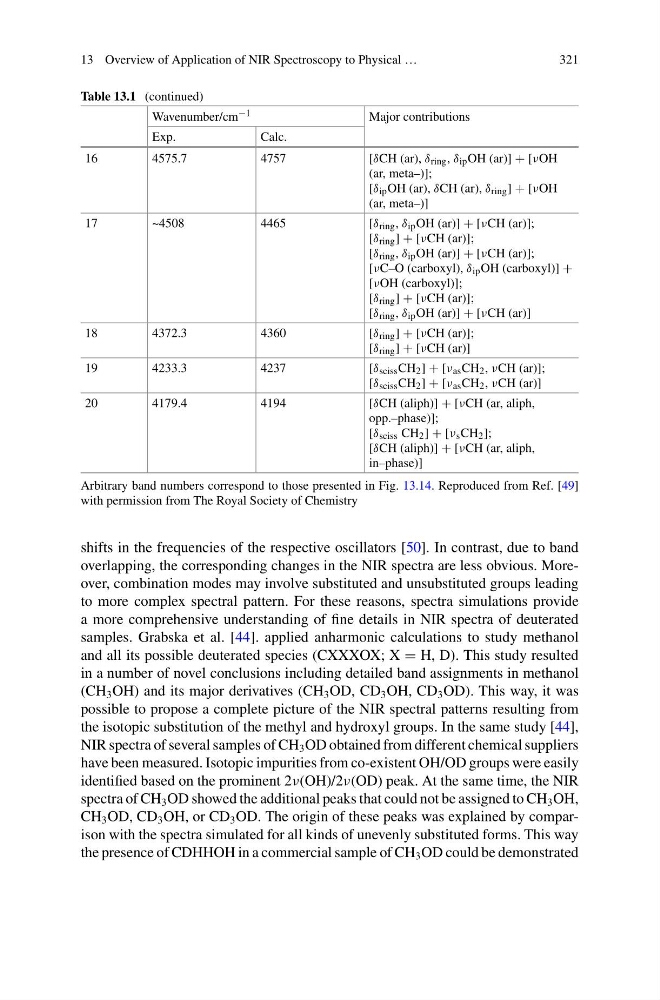
Table 13.1 (continued)
Wavenumber/cm −1
Major contributions
Exp.
Calc.
16
4575.7
4757
[δCH (ar), δ ring , δ ip OH (ar)] + [νOH
(ar, meta–)];
[δ ip OH (ar), δCH (ar), δ ring ] + [νOH
(ar, meta–)]
17
~4508
4465
[δ ring , δ ip OH (ar)] + [νCH (ar)];
[δ ring ] + [νCH (ar)];
[δ ring , δ ip OH (ar)] + [νCH (ar)];
[νC–O (carboxyl), δ ip OH (carboxyl)] +
[νOH (carboxyl)];
[δ ring ] + [νCH (ar)];
[δ ring , δ ip OH (ar)] + [νCH (ar)]
18
4372.3
4360
[δ ring ] + [νCH (ar)];
[δ ring ] + [νCH (ar)]
19
4233.3
4237
[δ sciss CH 2 ] + [ν as CH 2 , νCH (ar)];
[δ sciss CH 2 ] + [ν as CH 2 , νCH (ar)]
20
4179.4
4194
[δCH (aliph)] + [νCH (ar, aliph,
opp.–phase)];
[δ sciss CH 2 ] + [ν s CH 2 ];
[δCH (aliph)] + [νCH (ar, aliph,
in–phase)]
Arbitrary band numbers correspond to those presented in Fig. 13.14. Reproduced from Ref. [49]
with permission from The Royal Society of Chemistry
shifts in the frequencies of the respective oscillators [50]. In contrast, due to band
overlapping, the corresponding changes in the NIR spectra are less obvious. Moreover, combination modes may involve substituted and unsubstituted groups leading
to more complex spectral pattern. For these reasons, spectra simulations provide
a more comprehensive understanding of fine details in NIR spectra of deuterated
samples. Grabska et al. [44]. applied anharmonic calculations to study methanol
and all its possible deuterated species (CXXXOX; X = H, D). This study resulted
in a number of novel conclusions including detailed band assignments in methanol
(CH 3 OH) and its major derivatives (CH 3 OD, CD 3 OH, CD 3 OD). This way, it was
possible to propose a complete picture of the NIR spectral patterns resulting from
the isotopic substitution of the methyl and hydroxyl groups. In the same study [44],
NIR spectra of several samples of CH 3 OD obtained from different chemical suppliers
have been measured. Isotopic impurities from co-existent OH/OD groups were easily
identified based on the prominent 2ν(OH)/2ν(OD) peak. At the same time, the NIR
spectra of CH 3 OD showed the additional peaks that could not be assigned to CH 3 OH,
CH 3 OD, CD 3 OH, or CD 3 OD. The origin of these peaks was explained by comparison with the spectra simulated for all kinds of unevenly substituted forms. This way
the presence of CDHHOH in a commercial sample of CH 3 OD could be demonstrated
321
Table 13.1 (continued)
Wavenumber/cm −1
Major contributions
Exp.
Calc.
16
4575.7
4757
[δCH (ar), δ ring , δ ip OH (ar)] + [νOH
(ar, meta–)];
[δ ip OH (ar), δCH (ar), δ ring ] + [νOH
(ar, meta–)]
17
~4508
4465
[δ ring , δ ip OH (ar)] + [νCH (ar)];
[δ ring ] + [νCH (ar)];
[δ ring , δ ip OH (ar)] + [νCH (ar)];
[νC–O (carboxyl), δ ip OH (carboxyl)] +
[νOH (carboxyl)];
[δ ring ] + [νCH (ar)];
[δ ring , δ ip OH (ar)] + [νCH (ar)]
18
4372.3
4360
[δ ring ] + [νCH (ar)];
[δ ring ] + [νCH (ar)]
19
4233.3
4237
[δ sciss CH 2 ] + [ν as CH 2 , νCH (ar)];
[δ sciss CH 2 ] + [ν as CH 2 , νCH (ar)]
20
4179.4
4194
[δCH (aliph)] + [νCH (ar, aliph,
opp.–phase)];
[δ sciss CH 2 ] + [ν s CH 2 ];
[δCH (aliph)] + [νCH (ar, aliph,
in–phase)]
Arbitrary band numbers correspond to those presented in Fig. 13.14. Reproduced from Ref. [49]
with permission from The Royal Society of Chemistry
shifts in the frequencies of the respective oscillators [50]. In contrast, due to band
overlapping, the corresponding changes in the NIR spectra are less obvious. Moreover, combination modes may involve substituted and unsubstituted groups leading
to more complex spectral pattern. For these reasons, spectra simulations provide
a more comprehensive understanding of fine details in NIR spectra of deuterated
samples. Grabska et al. [44]. applied anharmonic calculations to study methanol
and all its possible deuterated species (CXXXOX; X = H, D). This study resulted
in a number of novel conclusions including detailed band assignments in methanol
(CH 3 OH) and its major derivatives (CH 3 OD, CD 3 OH, CD 3 OD). This way, it was
possible to propose a complete picture of the NIR spectral patterns resulting from
the isotopic substitution of the methyl and hydroxyl groups. In the same study [44],
NIR spectra of several samples of CH 3 OD obtained from different chemical suppliers
have been measured. Isotopic impurities from co-existent OH/OD groups were easily
identified based on the prominent 2ν(OH)/2ν(OD) peak. At the same time, the NIR
spectra of CH 3 OD showed the additional peaks that could not be assigned to CH 3 OH,
CH 3 OD, CD 3 OH, or CD 3 OD. The origin of these peaks was explained by comparison with the spectra simulated for all kinds of unevenly substituted forms. This way
the presence of CDHHOH in a commercial sample of CH 3 OD could be demonstrated