

308
M. A. Czarnecki et al.
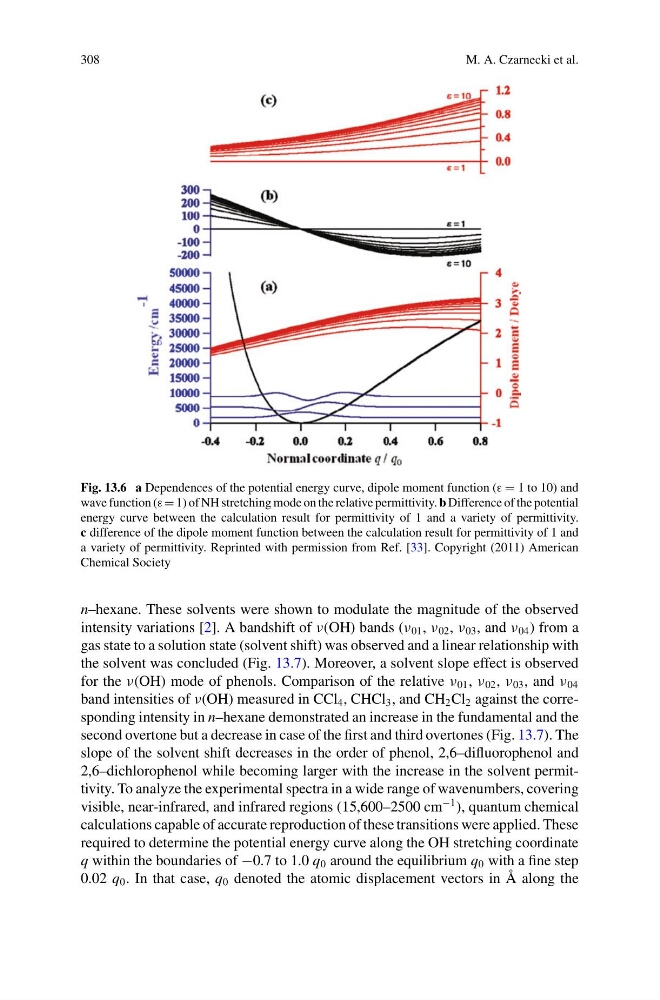
Fig. 13.6 a Dependences of the potential energy curve, dipole moment function (ε = 1 to 10) and
wave function (ε = 1) of NH stretching mode on the relative permittivity. b Difference of the potential
energy curve between the calculation result for permittivity of 1 and a variety of permittivity.
c difference of the dipole moment function between the calculation result for permittivity of 1 and
a variety of permittivity. Reprinted with permission from Ref. [33]. Copyright (2011) American
Chemical Society
n–hexane. These solvents were shown to modulate the magnitude of the observed
intensity variations [2]. A bandshift of ν(OH) bands (ν 01 , ν 02 , ν 03 , and ν 04 ) from a
gas state to a solution state (solvent shift) was observed and a linear relationship with
the solvent was concluded (Fig. 13.7). Moreover, a solvent slope effect is observed
for the ν(OH) mode of phenols. Comparison of the relative ν 01 , ν 02 , ν 03 , and ν 04
band intensities of ν(OH) measured in CCl 4 , CHCl 3 , and CH 2 Cl 2 against the corresponding intensity in n–hexane demonstrated an increase in the fundamental and the
second overtone but a decrease in case of the first and third overtones (Fig. 13.7). The
slope of the solvent shift decreases in the order of phenol, 2,6–difluorophenol and
2,6–dichlorophenol while becoming larger with the increase in the solvent permittivity. To analyze the experimental spectra in a wide range of wavenumbers, covering
visible, near-infrared, and infrared regions (15,600–2500 cm
−1 ), quantum chemical
calculations capable of accurate reproduction of these transitions were applied. These
required to determine the potential energy curve along the OH stretching coordinate
q within the boundaries of −0.7 to 1.0 q 0 around the equilibrium q 0 with a fine step
0.02 q 0 . In that case, q 0 denoted the atomic displacement vectors in Å along the
M. A. Czarnecki et al.
Fig. 13.6 a Dependences of the potential energy curve, dipole moment function (ε = 1 to 10) and
wave function (ε = 1) of NH stretching mode on the relative permittivity. b Difference of the potential
energy curve between the calculation result for permittivity of 1 and a variety of permittivity.
c difference of the dipole moment function between the calculation result for permittivity of 1 and
a variety of permittivity. Reprinted with permission from Ref. [33]. Copyright (2011) American
Chemical Society
n–hexane. These solvents were shown to modulate the magnitude of the observed
intensity variations [2]. A bandshift of ν(OH) bands (ν 01 , ν 02 , ν 03 , and ν 04 ) from a
gas state to a solution state (solvent shift) was observed and a linear relationship with
the solvent was concluded (Fig. 13.7). Moreover, a solvent slope effect is observed
for the ν(OH) mode of phenols. Comparison of the relative ν 01 , ν 02 , ν 03 , and ν 04
band intensities of ν(OH) measured in CCl 4 , CHCl 3 , and CH 2 Cl 2 against the corresponding intensity in n–hexane demonstrated an increase in the fundamental and the
second overtone but a decrease in case of the first and third overtones (Fig. 13.7). The
slope of the solvent shift decreases in the order of phenol, 2,6–difluorophenol and
2,6–dichlorophenol while becoming larger with the increase in the solvent permittivity. To analyze the experimental spectra in a wide range of wavenumbers, covering
visible, near-infrared, and infrared regions (15,600–2500 cm
−1 ), quantum chemical
calculations capable of accurate reproduction of these transitions were applied. These
required to determine the potential energy curve along the OH stretching coordinate
q within the boundaries of −0.7 to 1.0 q 0 around the equilibrium q 0 with a fine step
0.02 q 0 . In that case, q 0 denoted the atomic displacement vectors in Å along the