

10 Hardware of Near-Infrared Spectroscopy
241
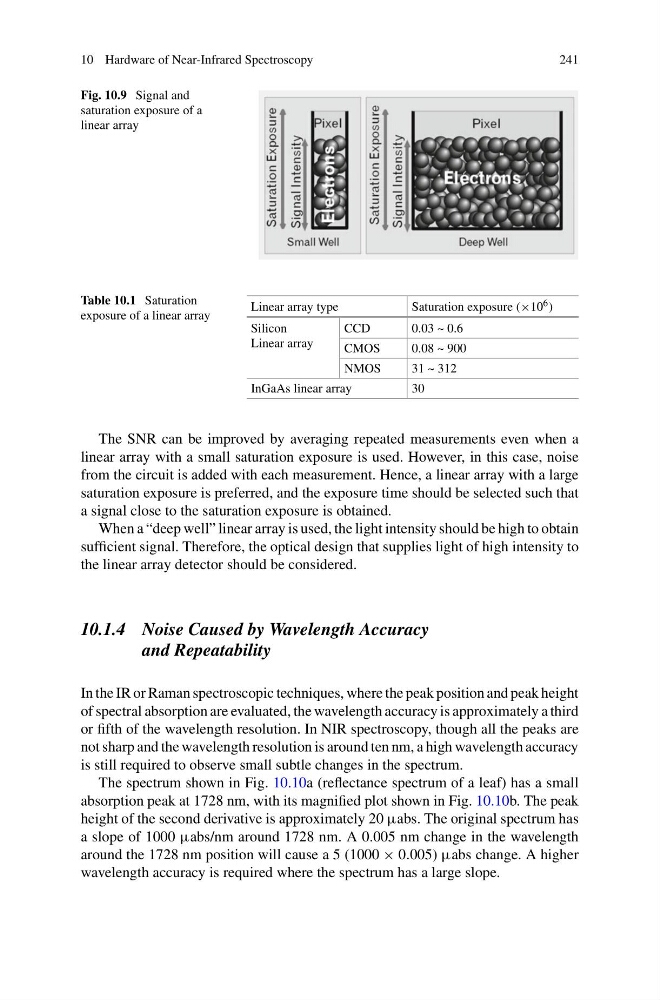
Fig. 10.9 Signal and
saturation exposure of a
linear array
Table 10.1 Saturation
exposure of a linear array
Linear array type
Saturation exposure (×10 6 )
Silicon
Linear array
CCD
0.03 ~ 0.6
CMOS
0.08 ~ 900
NMOS
31 ~ 312
InGaAs linear array
30
The SNR can be improved by averaging repeated measurements even when a
linear array with a small saturation exposure is used. However, in this case, noise
from the circuit is added with each measurement. Hence, a linear array with a large
saturation exposure is preferred, and the exposure time should be selected such that
a signal close to the saturation exposure is obtained.
When a “deep well” linear array is used, the light intensity should be high to obtain
sufficient signal. Therefore, the optical design that supplies light of high intensity to
the linear array detector should be considered.
10.1.4 Noise Caused by Wavelength Accuracy
and Repeatability
In the IR or Raman spectroscopic techniques, where the peak position and peak height
of spectral absorption are evaluated, the wavelength accuracy is approximately a third
or fifth of the wavelength resolution. In NIR spectroscopy, though all the peaks are
not sharp and the wavelength resolution is around ten nm, a high wavelength accuracy
is still required to observe small subtle changes in the spectrum.
The spectrum shown in Fig. 10.10a (reflectance spectrum of a leaf) has a small
absorption peak at 1728 nm, with its magnified plot shown in Fig. 10.10b. The peak
height of the second derivative is approximately 20 µabs. The original spectrum has
a slope of 1000 µabs/nm around 1728 nm. A 0.005 nm change in the wavelength
around the 1728 nm position will cause a 5 (1000 × 0.005) µabs change. A higher
wavelength accuracy is required where the spectrum has a large slope.
241
Fig. 10.9 Signal and
saturation exposure of a
linear array
Table 10.1 Saturation
exposure of a linear array
Linear array type
Saturation exposure (×10 6 )
Silicon
Linear array
CCD
0.03 ~ 0.6
CMOS
0.08 ~ 900
NMOS
31 ~ 312
InGaAs linear array
30
The SNR can be improved by averaging repeated measurements even when a
linear array with a small saturation exposure is used. However, in this case, noise
from the circuit is added with each measurement. Hence, a linear array with a large
saturation exposure is preferred, and the exposure time should be selected such that
a signal close to the saturation exposure is obtained.
When a “deep well” linear array is used, the light intensity should be high to obtain
sufficient signal. Therefore, the optical design that supplies light of high intensity to
the linear array detector should be considered.
10.1.4 Noise Caused by Wavelength Accuracy
and Repeatability
In the IR or Raman spectroscopic techniques, where the peak position and peak height
of spectral absorption are evaluated, the wavelength accuracy is approximately a third
or fifth of the wavelength resolution. In NIR spectroscopy, though all the peaks are
not sharp and the wavelength resolution is around ten nm, a high wavelength accuracy
is still required to observe small subtle changes in the spectrum.
The spectrum shown in Fig. 10.10a (reflectance spectrum of a leaf) has a small
absorption peak at 1728 nm, with its magnified plot shown in Fig. 10.10b. The peak
height of the second derivative is approximately 20 µabs. The original spectrum has
a slope of 1000 µabs/nm around 1728 nm. A 0.005 nm change in the wavelength
around the 1728 nm position will cause a 5 (1000 × 0.005) µabs change. A higher
wavelength accuracy is required where the spectrum has a large slope.