

7 NIR Data Exploration and Regression by Chemometrics—A Primer
173
1 2
4
6
8
10
Number of components
1
2
3
RMSE
RMSEC
RMSECV
0
2 0
4 0
6 0
8 0
%DE Measured
0
20
40
60
80
%DE CV
predicted
1100
1500
2000
2500
Wavelength [nm]
-5000
0
5000
Regression vector
2244
nm
a
b
c
RMSECV = 2.151
R 2 = 0.98
3 Components
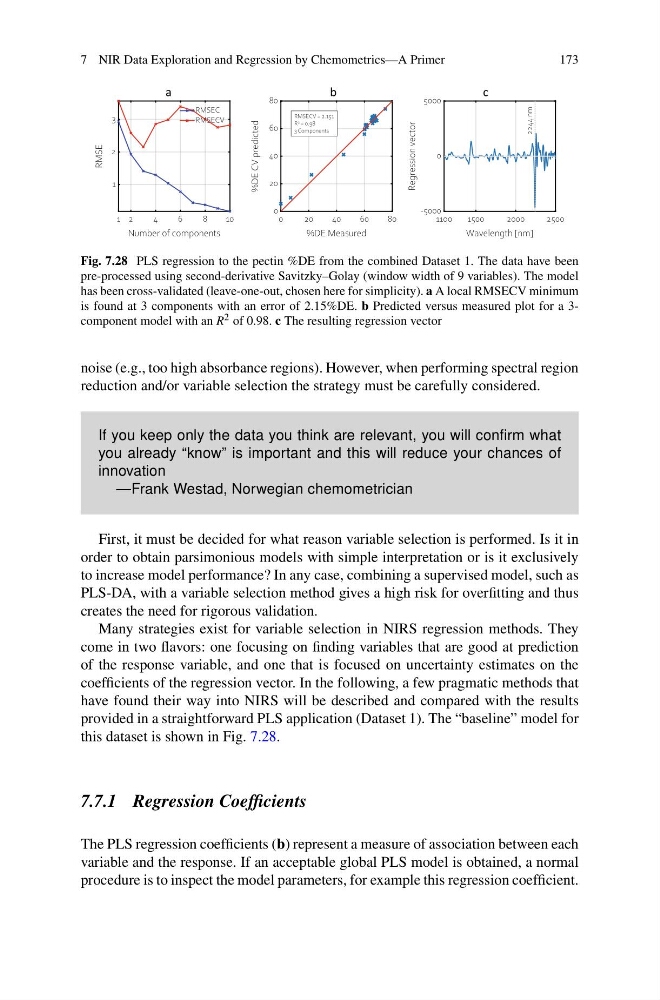
Fig. 7.28 PLS regression to the pectin %DE from the combined Dataset 1. The data have been
pre-processed using second-derivative Savitzky–Golay (window width of 9 variables). The model
has been cross-validated (leave-one-out, chosen here for simplicity). a A local RMSECV minimum
is found at 3 components with an error of 2.15%DE. b Predicted versus measured plot for a 3component model with an R 2 of 0.98. c The resulting regression vector
noise (e.g., too high absorbance regions). However, when performing spectral region
reduction and/or variable selection the strategy must be carefully considered.
If you keep only the data you think are relevant, you will confirm what
you already “know” is important and this will reduce your chances of
innovation
—Frank Westad, Norwegian chemometrician
First, it must be decided for what reason variable selection is performed. Is it in
order to obtain parsimonious models with simple interpretation or is it exclusively
to increase model performance? In any case, combining a supervised model, such as
PLS-DA, with a variable selection method gives a high risk for overfitting and thus
creates the need for rigorous validation.
Many strategies exist for variable selection in NIRS regression methods. They
come in two flavors: one focusing on finding variables that are good at prediction
of the response variable, and one that is focused on uncertainty estimates on the
coefficients of the regression vector. In the following, a few pragmatic methods that
have found their way into NIRS will be described and compared with the results
provided in a straightforward PLS application (Dataset 1). The “baseline” model for
this dataset is shown in Fig. 7.28.
7.7.1 Regression Coefficients
The PLS regression coefficients (b) represent a measure of association between each
variable and the response. If an acceptable global PLS model is obtained, a normal
procedure is to inspect the model parameters, for example this regression coefficient.
173
1 2
4
6
8
10
Number of components
1
2
3
RMSE
RMSEC
RMSECV
0
2 0
4 0
6 0
8 0
%DE Measured
0
20
40
60
80
%DE CV
predicted
1100
1500
2000
2500
Wavelength [nm]
-5000
0
5000
Regression vector
2244
nm
a
b
c
RMSECV = 2.151
R 2 = 0.98
3 Components
Fig. 7.28 PLS regression to the pectin %DE from the combined Dataset 1. The data have been
pre-processed using second-derivative Savitzky–Golay (window width of 9 variables). The model
has been cross-validated (leave-one-out, chosen here for simplicity). a A local RMSECV minimum
is found at 3 components with an error of 2.15%DE. b Predicted versus measured plot for a 3component model with an R 2 of 0.98. c The resulting regression vector
noise (e.g., too high absorbance regions). However, when performing spectral region
reduction and/or variable selection the strategy must be carefully considered.
If you keep only the data you think are relevant, you will confirm what
you already “know” is important and this will reduce your chances of
innovation
—Frank Westad, Norwegian chemometrician
First, it must be decided for what reason variable selection is performed. Is it in
order to obtain parsimonious models with simple interpretation or is it exclusively
to increase model performance? In any case, combining a supervised model, such as
PLS-DA, with a variable selection method gives a high risk for overfitting and thus
creates the need for rigorous validation.
Many strategies exist for variable selection in NIRS regression methods. They
come in two flavors: one focusing on finding variables that are good at prediction
of the response variable, and one that is focused on uncertainty estimates on the
coefficients of the regression vector. In the following, a few pragmatic methods that
have found their way into NIRS will be described and compared with the results
provided in a straightforward PLS application (Dataset 1). The “baseline” model for
this dataset is shown in Fig. 7.28.
7.7.1 Regression Coefficients
The PLS regression coefficients (b) represent a measure of association between each
variable and the response. If an acceptable global PLS model is obtained, a normal
procedure is to inspect the model parameters, for example this regression coefficient.