

7 NIR Data Exploration and Regression by Chemometrics—A Primer
163
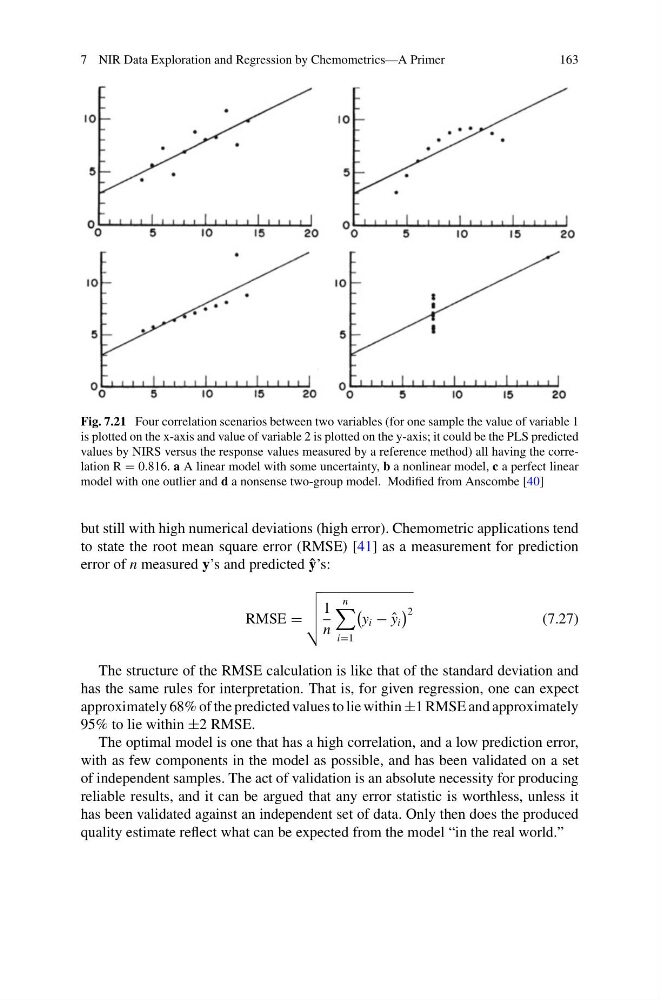
Fig. 7.21 Four correlation scenarios between two variables (for one sample the value of variable 1
is plotted on the x-axis and value of variable 2 is plotted on the y-axis; it could be the PLS predicted
values by NIRS versus the response values measured by a reference method) all having the correlation R = 0.816. a A linear model with some uncertainty, b a nonlinear model, c a perfect linear
model with one outlier and d a nonsense two-group model. Modified from Anscombe [40]
but still with high numerical deviations (high error). Chemometric applications tend
to state the root mean square error (RMSE) [41] as a measurement for prediction
error of n measured y’s and predicted ˆ
y’s:
RMSE =
1
n
n
i=1
y i − ˆ
y i
2
(7.27)
The structure of the RMSE calculation is like that of the standard deviation and
has the same rules for interpretation. That is, for given regression, one can expect
approximately 68% of the predicted values to lie within ±1 RMSE and approximately
95% to lie within ±2 RMSE.
The optimal model is one that has a high correlation, and a low prediction error,
with as few components in the model as possible, and has been validated on a set
of independent samples. The act of validation is an absolute necessity for producing
reliable results, and it can be argued that any error statistic is worthless, unless it
has been validated against an independent set of data. Only then does the produced
quality estimate reflect what can be expected from the model “in the real world.”
163
Fig. 7.21 Four correlation scenarios between two variables (for one sample the value of variable 1
is plotted on the x-axis and value of variable 2 is plotted on the y-axis; it could be the PLS predicted
values by NIRS versus the response values measured by a reference method) all having the correlation R = 0.816. a A linear model with some uncertainty, b a nonlinear model, c a perfect linear
model with one outlier and d a nonsense two-group model. Modified from Anscombe [40]
but still with high numerical deviations (high error). Chemometric applications tend
to state the root mean square error (RMSE) [41] as a measurement for prediction
error of n measured y’s and predicted ˆ
y’s:
RMSE =
1
n
n
i=1
y i − ˆ
y i
2
(7.27)
The structure of the RMSE calculation is like that of the standard deviation and
has the same rules for interpretation. That is, for given regression, one can expect
approximately 68% of the predicted values to lie within ±1 RMSE and approximately
95% to lie within ±2 RMSE.
The optimal model is one that has a high correlation, and a low prediction error,
with as few components in the model as possible, and has been validated on a set
of independent samples. The act of validation is an absolute necessity for producing
reliable results, and it can be argued that any error statistic is worthless, unless it
has been validated against an independent set of data. Only then does the produced
quality estimate reflect what can be expected from the model “in the real world.”