

156
K. M. Sørensen et al.
-2.5
-2
-1.5
-1
-0.5
0
0.5
1
1.5
2
2.5
Scores, PC1
-2.5
-2
-1.5
-1
-0.5
0
0.5
1
1.5
2
2.5
Scores, PC2
v
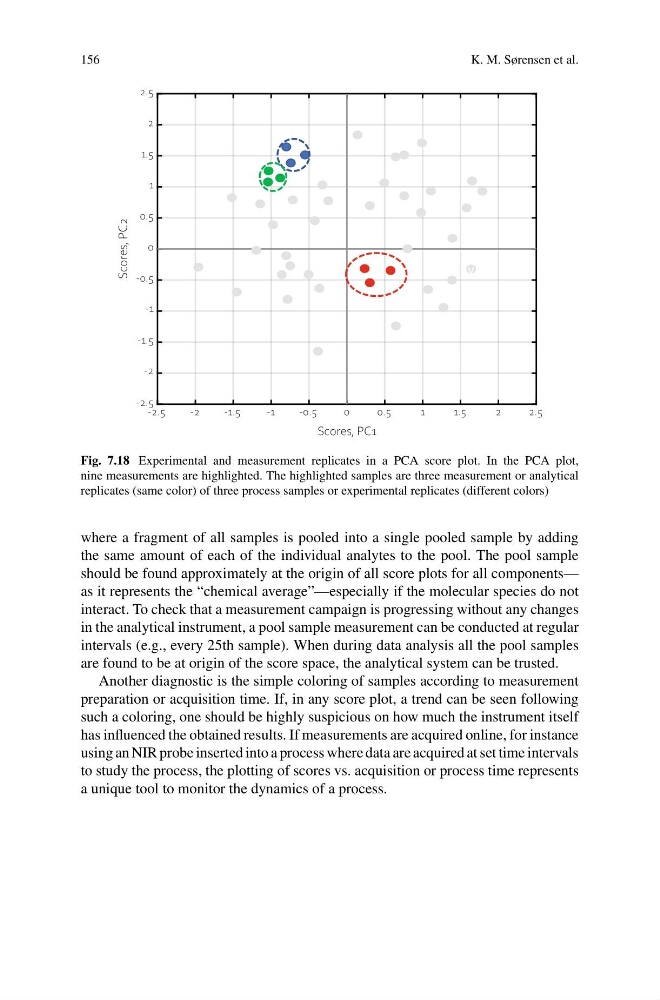
Fig. 7.18 Experimental and measurement replicates in a PCA score plot. In the PCA plot,
nine measurements are highlighted. The highlighted samples are three measurement or analytical
replicates (same color) of three process samples or experimental replicates (different colors)
where a fragment of all samples is pooled into a single pooled sample by adding
the same amount of each of the individual analytes to the pool. The pool sample
should be found approximately at the origin of all score plots for all components—
as it represents the “chemical average”—especially if the molecular species do not
interact. To check that a measurement campaign is progressing without any changes
in the analytical instrument, a pool sample measurement can be conducted at regular
intervals (e.g., every 25th sample). When during data analysis all the pool samples
are found to be at origin of the score space, the analytical system can be trusted.
Another diagnostic is the simple coloring of samples according to measurement
preparation or acquisition time. If, in any score plot, a trend can be seen following
such a coloring, one should be highly suspicious on how much the instrument itself
has influenced the obtained results. If measurements are acquired online, for instance
using an NIR probe inserted into a process where data are acquired at set time intervals
to study the process, the plotting of scores vs. acquisition or process time represents
a unique tool to monitor the dynamics of a process.
K. M. Sørensen et al.
-2.5
-2
-1.5
-1
-0.5
0
0.5
1
1.5
2
2.5
Scores, PC1
-2.5
-2
-1.5
-1
-0.5
0
0.5
1
1.5
2
2.5
Scores, PC2
v
Fig. 7.18 Experimental and measurement replicates in a PCA score plot. In the PCA plot,
nine measurements are highlighted. The highlighted samples are three measurement or analytical
replicates (same color) of three process samples or experimental replicates (different colors)
where a fragment of all samples is pooled into a single pooled sample by adding
the same amount of each of the individual analytes to the pool. The pool sample
should be found approximately at the origin of all score plots for all components—
as it represents the “chemical average”—especially if the molecular species do not
interact. To check that a measurement campaign is progressing without any changes
in the analytical instrument, a pool sample measurement can be conducted at regular
intervals (e.g., every 25th sample). When during data analysis all the pool samples
are found to be at origin of the score space, the analytical system can be trusted.
Another diagnostic is the simple coloring of samples according to measurement
preparation or acquisition time. If, in any score plot, a trend can be seen following
such a coloring, one should be highly suspicious on how much the instrument itself
has influenced the obtained results. If measurements are acquired online, for instance
using an NIR probe inserted into a process where data are acquired at set time intervals
to study the process, the plotting of scores vs. acquisition or process time represents
a unique tool to monitor the dynamics of a process.