

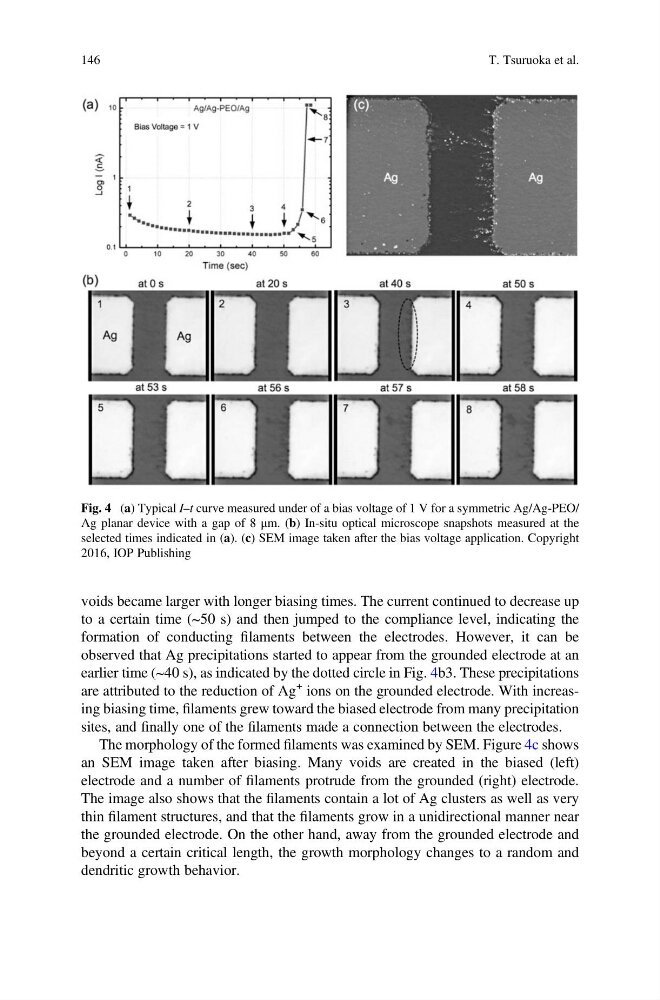
voids became larger with longer biasing times. The current continued to decrease up
to a certain time (~50 s) and then jumped to the compliance level, indicating the
formation of conducting filaments between the electrodes. However, it can be
observed that Ag precipitations started to appear from the grounded electrode at an
earlier time (~40 s), as indicated by the dotted circle in Fig. 4b3. These precipitations
are attributed to the reduction of Ag
+ ions on the grounded electrode. With increasing biasing time, filaments grew toward the biased electrode from many precipitation
sites, and finally one of the filaments made a connection between the electrodes.
The morphology of the formed filaments was examined by SEM. Figure 4c shows
an SEM image taken after biasing. Many voids are created in the biased (left)
electrode and a number of filaments protrude from the grounded (right) electrode.
The image also shows that the filaments contain a lot of Ag clusters as well as very
thin filament structures, and that the filaments grow in a unidirectional manner near
the grounded electrode. On the other hand, away from the grounded electrode and
beyond a certain critical length, the growth morphology changes to a random and
dendritic growth behavior.
Fig. 4 (a) Typical I–t curve measured under of a bias voltage of 1 V for a symmetric Ag/Ag-PEO/
Ag planar device with a gap of 8 μm. (b) In-situ optical microscope snapshots measured at the
selected times indicated in (a). (c) SEM image taken after the bias voltage application. Copyright
2016, IOP Publishing
146
T. Tsuruoka et al.
to a certain time (~50 s) and then jumped to the compliance level, indicating the
formation of conducting filaments between the electrodes. However, it can be
observed that Ag precipitations started to appear from the grounded electrode at an
earlier time (~40 s), as indicated by the dotted circle in Fig. 4b3. These precipitations
are attributed to the reduction of Ag
+ ions on the grounded electrode. With increasing biasing time, filaments grew toward the biased electrode from many precipitation
sites, and finally one of the filaments made a connection between the electrodes.
The morphology of the formed filaments was examined by SEM. Figure 4c shows
an SEM image taken after biasing. Many voids are created in the biased (left)
electrode and a number of filaments protrude from the grounded (right) electrode.
The image also shows that the filaments contain a lot of Ag clusters as well as very
thin filament structures, and that the filaments grow in a unidirectional manner near
the grounded electrode. On the other hand, away from the grounded electrode and
beyond a certain critical length, the growth morphology changes to a random and
dendritic growth behavior.
Fig. 4 (a) Typical I–t curve measured under of a bias voltage of 1 V for a symmetric Ag/Ag-PEO/
Ag planar device with a gap of 8 μm. (b) In-situ optical microscope snapshots measured at the
selected times indicated in (a). (c) SEM image taken after the bias voltage application. Copyright
2016, IOP Publishing
146
T. Tsuruoka et al.