

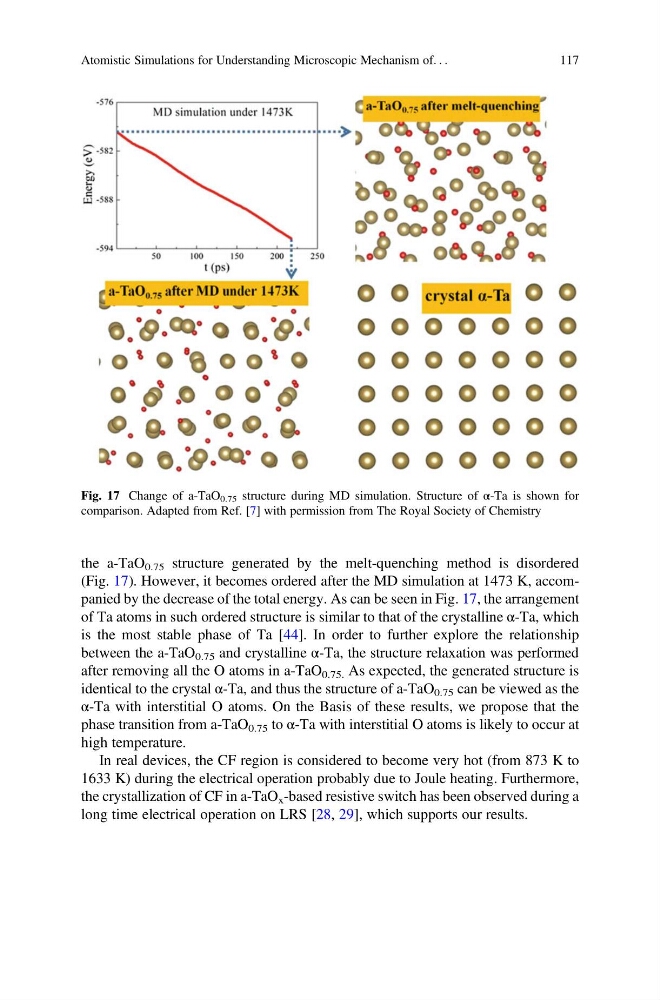
the a-TaO 0.75 structure generated by the melt-quenching method is disordered
(Fig. 17). However, it becomes ordered after the MD simulation at 1473 K, accompanied by the decrease of the total energy. As can be seen in Fig. 17, the arrangement
of Ta atoms in such ordered structure is similar to that of the crystalline α-Ta, which
is the most stable phase of Ta [44]. In order to further explore the relationship
between the a-TaO 0.75 and crystalline α-Ta, the structure relaxation was performed
after removing all the O atoms in a-TaO 0.75. As expected, the generated structure is
identical to the crystal α-Ta, and thus the structure of a-TaO 0.75 can be viewed as the
α-Ta with interstitial O atoms. On the Basis of these results, we propose that the
phase transition from a-TaO 0.75 to α-Ta with interstitial O atoms is likely to occur at
high temperature.
In real devices, the CF region is considered to become very hot (from 873 K to
1633 K) during the electrical operation probably due to Joule heating. Furthermore,
the crystallization of CF in a-TaO x -based resistive switch has been observed during a
long time electrical operation on LRS [28, 29], which supports our results.
Fig. 17 Change of a-TaO 0.75 structure during MD simulation. Structure of α-Ta is shown for
comparison. Adapted from Ref. [7] with permission from The Royal Society of Chemistry
Atomistic Simulations for Understanding Microscopic Mechanism of. . .
117
(Fig. 17). However, it becomes ordered after the MD simulation at 1473 K, accompanied by the decrease of the total energy. As can be seen in Fig. 17, the arrangement
of Ta atoms in such ordered structure is similar to that of the crystalline α-Ta, which
is the most stable phase of Ta [44]. In order to further explore the relationship
between the a-TaO 0.75 and crystalline α-Ta, the structure relaxation was performed
after removing all the O atoms in a-TaO 0.75. As expected, the generated structure is
identical to the crystal α-Ta, and thus the structure of a-TaO 0.75 can be viewed as the
α-Ta with interstitial O atoms. On the Basis of these results, we propose that the
phase transition from a-TaO 0.75 to α-Ta with interstitial O atoms is likely to occur at
high temperature.
In real devices, the CF region is considered to become very hot (from 873 K to
1633 K) during the electrical operation probably due to Joule heating. Furthermore,
the crystallization of CF in a-TaO x -based resistive switch has been observed during a
long time electrical operation on LRS [28, 29], which supports our results.
Fig. 17 Change of a-TaO 0.75 structure during MD simulation. Structure of α-Ta is shown for
comparison. Adapted from Ref. [7] with permission from The Royal Society of Chemistry
Atomistic Simulations for Understanding Microscopic Mechanism of. . .
117