

72
J. Knapik-Kowalczuk et al.
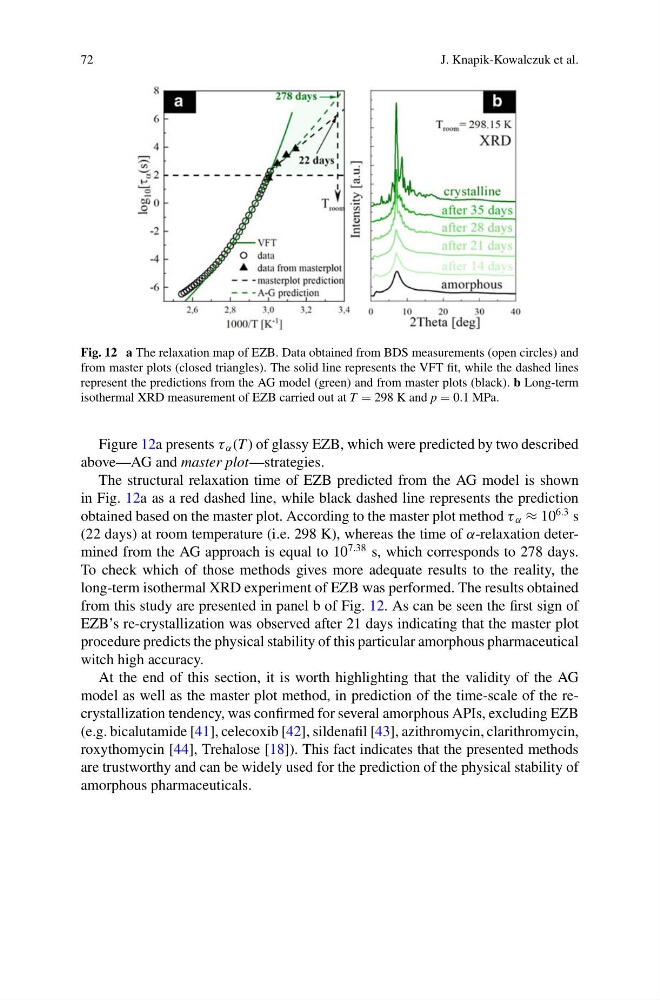
Fig. 12 a The relaxation map of EZB. Data obtained from BDS measurements (open circles) and
from master plots (closed triangles). The solid line represents the VFT fit, while the dashed lines
represent the predictions from the AG model (green) and from master plots (black). b Long-term
isothermal XRD measurement of EZB carried out at T = 298 K and p = 0.1 MPa.
Figure 12a presents τ α (T ) of glassy EZB, which were predicted by two described
above—AG and master plot—strategies.
The structural relaxation time of EZB predicted from the AG model is shown
in Fig. 12a as a red dashed line, while black dashed line represents the prediction
obtained based on the master plot. According to the master plot method τ α ≈ 10
6.3 s
(22 days) at room temperature (i.e. 298 K), whereas the time of α-relaxation determined from the AG approach is equal to 10
7.38 s, which corresponds to 278 days.
To check which of those methods gives more adequate results to the reality, the
long-term isothermal XRD experiment of EZB was performed. The results obtained
from this study are presented in panel b of Fig. 12. As can be seen the first sign of
EZB’s re-crystallization was observed after 21 days indicating that the master plot
procedure predicts the physical stability of this particular amorphous pharmaceutical
witch high accuracy.
At the end of this section, it is worth highlighting that the validity of the AG
model as well as the master plot method, in prediction of the time-scale of the recrystallization tendency, was confirmed for several amorphous APIs, excluding EZB
(e.g. bicalutamide [41], celecoxib [42], sildenafil [43], azithromycin, clarithromycin,
roxythomycin [44], Trehalose [18]). This fact indicates that the presented methods
are trustworthy and can be widely used for the prediction of the physical stability of
amorphous pharmaceuticals.
J. Knapik-Kowalczuk et al.
Fig. 12 a The relaxation map of EZB. Data obtained from BDS measurements (open circles) and
from master plots (closed triangles). The solid line represents the VFT fit, while the dashed lines
represent the predictions from the AG model (green) and from master plots (black). b Long-term
isothermal XRD measurement of EZB carried out at T = 298 K and p = 0.1 MPa.
Figure 12a presents τ α (T ) of glassy EZB, which were predicted by two described
above—AG and master plot—strategies.
The structural relaxation time of EZB predicted from the AG model is shown
in Fig. 12a as a red dashed line, while black dashed line represents the prediction
obtained based on the master plot. According to the master plot method τ α ≈ 10
6.3 s
(22 days) at room temperature (i.e. 298 K), whereas the time of α-relaxation determined from the AG approach is equal to 10
7.38 s, which corresponds to 278 days.
To check which of those methods gives more adequate results to the reality, the
long-term isothermal XRD experiment of EZB was performed. The results obtained
from this study are presented in panel b of Fig. 12. As can be seen the first sign of
EZB’s re-crystallization was observed after 21 days indicating that the master plot
procedure predicts the physical stability of this particular amorphous pharmaceutical
witch high accuracy.
At the end of this section, it is worth highlighting that the validity of the AG
model as well as the master plot method, in prediction of the time-scale of the recrystallization tendency, was confirmed for several amorphous APIs, excluding EZB
(e.g. bicalutamide [41], celecoxib [42], sildenafil [43], azithromycin, clarithromycin,
roxythomycin [44], Trehalose [18]). This fact indicates that the presented methods
are trustworthy and can be widely used for the prediction of the physical stability of
amorphous pharmaceuticals.