

High-Pressure Crystallization of Glass-Forming Liquids …
41
0
2 0 0 0
4 0 0 0
6 0 0 0
1.2
1.6
2.0
2.4
Path 2
Path 2
Path 1
ε' (at 2 kHz)
time (s)
Crystallization progress at 283 K and 100 MPa
t 1/2 =51 min, t ind =38 min
t 1/2 =27 min, t ind =16 min
liquid
crystal
0
1 0 0
2 0 0
270
300
330
x
T m =297 K (at 100 MPa)
(308 K, 0.1 MPa)
Crystallization Point (T c , p c )
Temperature (K)
Pressure (MPa)
Starting Point (T 0 ,p 0 )
Path 1
T m (P)
(283 K,100 MPa)
x
T m =283 K (at 50 MPa)
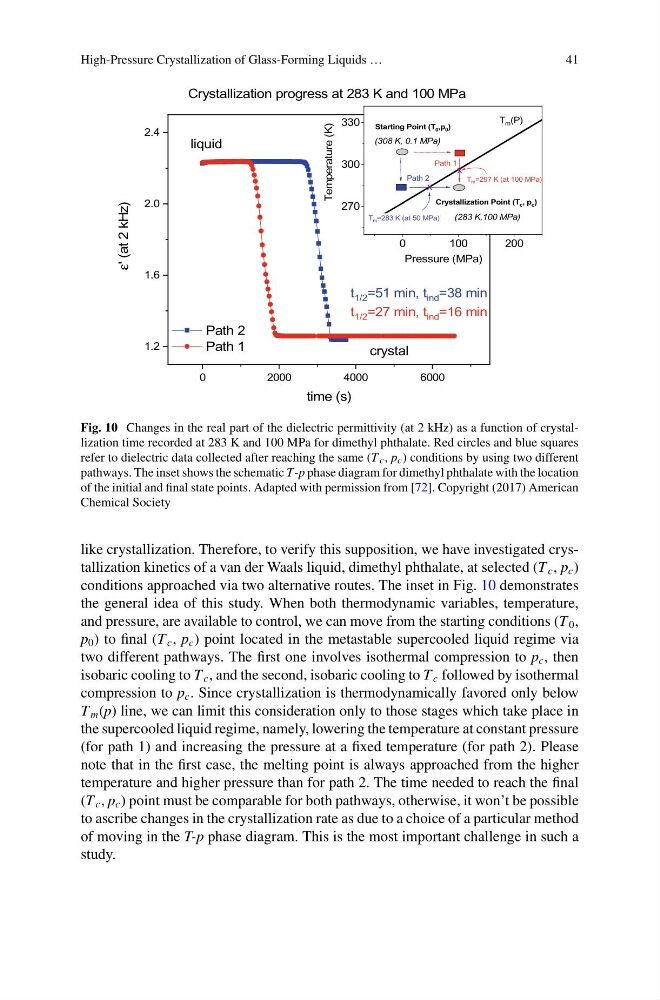
Fig. 10 Changes in the real part of the dielectric permittivity (at 2 kHz) as a function of crystallization time recorded at 283 K and 100 MPa for dimethyl phthalate. Red circles and blue squares
refer to dielectric data collected after reaching the same (T c , p c ) conditions by using two different
pathways. The inset shows the schematic T-p phase diagram for dimethyl phthalate with the location
of the initial and final state points. Adapted with permission from [72]. Copyright (2017) American
Chemical Society
like crystallization. Therefore, to verify this supposition, we have investigated crystallization kinetics of a van der Waals liquid, dimethyl phthalate, at selected (T c , p c )
conditions approached via two alternative routes. The inset in Fig. 10 demonstrates
the general idea of this study. When both thermodynamic variables, temperature,
and pressure, are available to control, we can move from the starting conditions (T 0 ,
p 0 ) to final (T c , p c ) point located in the metastable supercooled liquid regime via
two different pathways. The first one involves isothermal compression to p c , then
isobaric cooling to T c , and the second, isobaric cooling to T c followed by isothermal
compression to p c . Since crystallization is thermodynamically favored only below
T m (p) line, we can limit this consideration only to those stages which take place in
the supercooled liquid regime, namely, lowering the temperature at constant pressure
(for path 1) and increasing the pressure at a fixed temperature (for path 2). Please
note that in the first case, the melting point is always approached from the higher
temperature and higher pressure than for path 2. The time needed to reach the final
(T c , p c ) point must be comparable for both pathways, otherwise, it won’t be possible
to ascribe changes in the crystallization rate as due to a choice of a particular method
of moving in the T-p phase diagram. This is the most important challenge in such a
study.
41
0
2 0 0 0
4 0 0 0
6 0 0 0
1.2
1.6
2.0
2.4
Path 2
Path 2
Path 1
ε' (at 2 kHz)
time (s)
Crystallization progress at 283 K and 100 MPa
t 1/2 =51 min, t ind =38 min
t 1/2 =27 min, t ind =16 min
liquid
crystal
0
1 0 0
2 0 0
270
300
330
x
T m =297 K (at 100 MPa)
(308 K, 0.1 MPa)
Crystallization Point (T c , p c )
Temperature (K)
Pressure (MPa)
Starting Point (T 0 ,p 0 )
Path 1
T m (P)
(283 K,100 MPa)
x
T m =283 K (at 50 MPa)
Fig. 10 Changes in the real part of the dielectric permittivity (at 2 kHz) as a function of crystallization time recorded at 283 K and 100 MPa for dimethyl phthalate. Red circles and blue squares
refer to dielectric data collected after reaching the same (T c , p c ) conditions by using two different
pathways. The inset shows the schematic T-p phase diagram for dimethyl phthalate with the location
of the initial and final state points. Adapted with permission from [72]. Copyright (2017) American
Chemical Society
like crystallization. Therefore, to verify this supposition, we have investigated crystallization kinetics of a van der Waals liquid, dimethyl phthalate, at selected (T c , p c )
conditions approached via two alternative routes. The inset in Fig. 10 demonstrates
the general idea of this study. When both thermodynamic variables, temperature,
and pressure, are available to control, we can move from the starting conditions (T 0 ,
p 0 ) to final (T c , p c ) point located in the metastable supercooled liquid regime via
two different pathways. The first one involves isothermal compression to p c , then
isobaric cooling to T c , and the second, isobaric cooling to T c followed by isothermal
compression to p c . Since crystallization is thermodynamically favored only below
T m (p) line, we can limit this consideration only to those stages which take place in
the supercooled liquid regime, namely, lowering the temperature at constant pressure
(for path 1) and increasing the pressure at a fixed temperature (for path 2). Please
note that in the first case, the melting point is always approached from the higher
temperature and higher pressure than for path 2. The time needed to reach the final
(T c , p c ) point must be comparable for both pathways, otherwise, it won’t be possible
to ascribe changes in the crystallization rate as due to a choice of a particular method
of moving in the T-p phase diagram. This is the most important challenge in such a
study.