

High-Pressure Crystallization of Glass-Forming Liquids …
39
which provide a similar type of information but considering only the course of continuous heating with a constant rate. The example of CHT diagram is given in Fig. 8b.
Since the crystallization tendency of PC is greatly increased when heating from the
glassy state, only a low-temperature side of the crystallization curve was possible to
be determined from the experimental studies. Nevertheless, by comparing the crystallization times recorded for the same temperature range on either cooling a liquid
or heating a glass we found that they can be much different. This leads to a very
important finding that the critical scanning rate necessary to avoid crystallization on
cooling might be not enough to prevent recrystallization of glass upon heating.
In the next step, we have constructed time-pressure-transformation (TPT) and
continuous-decompression-transformation (CDT) diagrams as the pressure analogs
for TTT and CHT diagrams. For PC, they are shown in Fig. 8c, d, respectively. The
maximum of the crystallization rate along isotherm 243 K is located at ~600 MPa
and forms a characteristic nose on the TPT diagram. Compression rates which do
not intersect the crystallization curve lead to vitrification. From the results presented
in Fig. 8c, it is an event that more than 10 MPa/min is needed to avoid crystallization
of PC upon pressurization. Thus, TPT diagram explains why the compression rates
of 2.6 and 5.8 MPa/min were found in the dielectric studies too slow to form the
glassy state. On the other hand, CDT diagrams show increased by almost one-decade
crystallization times for decompressed PC and thus rationalize faster processing times
needed to inhibit crystallization, as also observed in the dielectric study.
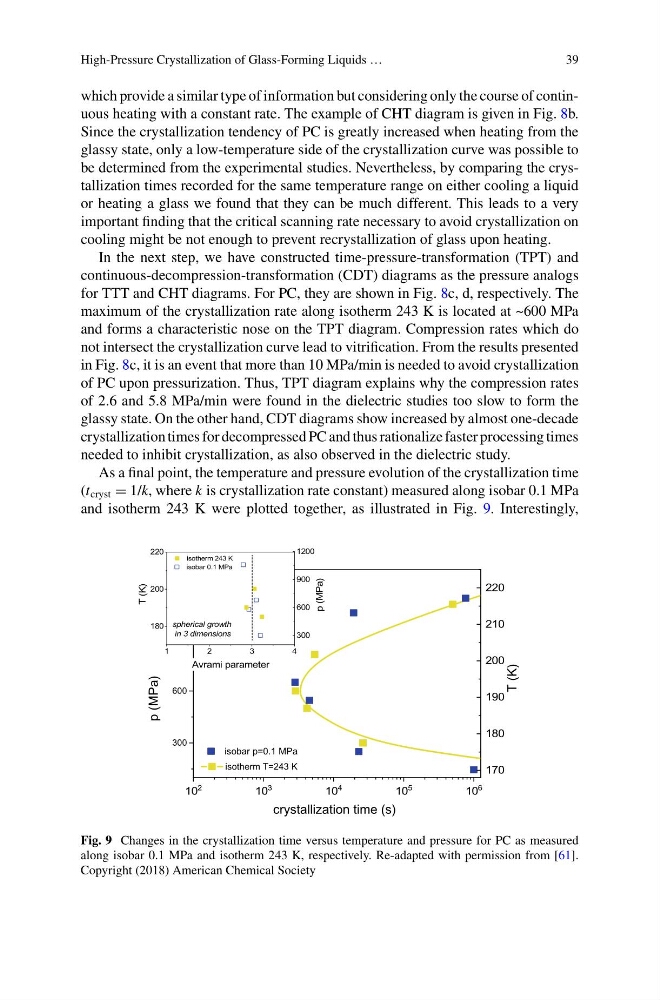
As a final point, the temperature and pressure evolution of the crystallization time
(t cryst = 1/k, where k is crystallization rate constant) measured along isobar 0.1 MPa
and isotherm 243 K were plotted together, as illustrated in Fig. 9. Interestingly,
10
2
10
3
10
4
10
5
10
6
300
600
900
1200
180
200
220
1
2
3
4
300
600
900
1200
isotherm T=243 K
p (MPa)
crystallization time (s)
170
180
190
200
210
220
isobar p=0.1 MPa
T (K)
spherical growth
in 3 dimensions
isobar 0.1 MPa
T (K)
Avrami parameter
p (MPa)
isotherm 243 K
Fig. 9 Changes in the crystallization time versus temperature and pressure for PC as measured
along isobar 0.1 MPa and isotherm 243 K, respectively. Re-adapted with permission from [61].
Copyright (2018) American Chemical Society
39
which provide a similar type of information but considering only the course of continuous heating with a constant rate. The example of CHT diagram is given in Fig. 8b.
Since the crystallization tendency of PC is greatly increased when heating from the
glassy state, only a low-temperature side of the crystallization curve was possible to
be determined from the experimental studies. Nevertheless, by comparing the crystallization times recorded for the same temperature range on either cooling a liquid
or heating a glass we found that they can be much different. This leads to a very
important finding that the critical scanning rate necessary to avoid crystallization on
cooling might be not enough to prevent recrystallization of glass upon heating.
In the next step, we have constructed time-pressure-transformation (TPT) and
continuous-decompression-transformation (CDT) diagrams as the pressure analogs
for TTT and CHT diagrams. For PC, they are shown in Fig. 8c, d, respectively. The
maximum of the crystallization rate along isotherm 243 K is located at ~600 MPa
and forms a characteristic nose on the TPT diagram. Compression rates which do
not intersect the crystallization curve lead to vitrification. From the results presented
in Fig. 8c, it is an event that more than 10 MPa/min is needed to avoid crystallization
of PC upon pressurization. Thus, TPT diagram explains why the compression rates
of 2.6 and 5.8 MPa/min were found in the dielectric studies too slow to form the
glassy state. On the other hand, CDT diagrams show increased by almost one-decade
crystallization times for decompressed PC and thus rationalize faster processing times
needed to inhibit crystallization, as also observed in the dielectric study.
As a final point, the temperature and pressure evolution of the crystallization time
(t cryst = 1/k, where k is crystallization rate constant) measured along isobar 0.1 MPa
and isotherm 243 K were plotted together, as illustrated in Fig. 9. Interestingly,
10
2
10
3
10
4
10
5
10
6
300
600
900
1200
180
200
220
1
2
3
4
300
600
900
1200
isotherm T=243 K
p (MPa)
crystallization time (s)
170
180
190
200
210
220
isobar p=0.1 MPa
T (K)
spherical growth
in 3 dimensions
isobar 0.1 MPa
T (K)
Avrami parameter
p (MPa)
isotherm 243 K
Fig. 9 Changes in the crystallization time versus temperature and pressure for PC as measured
along isobar 0.1 MPa and isotherm 243 K, respectively. Re-adapted with permission from [61].
Copyright (2018) American Chemical Society