

236
S. Napolitano
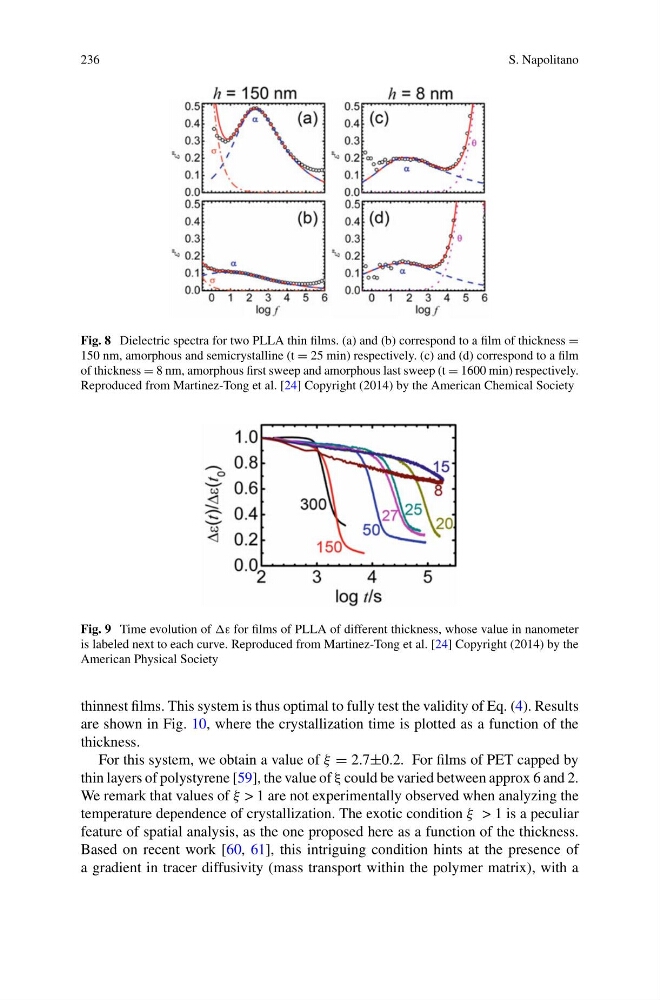
Fig. 8 Dielectric spectra for two PLLA thin films. (a) and (b) correspond to a film of thickness =
150 nm, amorphous and semicrystalline (t = 25 min) respectively. (c) and (d) correspond to a film
of thickness = 8 nm, amorphous first sweep and amorphous last sweep (t = 1600 min) respectively.
Reproduced from Martinez-Tong et al. [24] Copyright (2014) by the American Chemical Society
Fig. 9 Time evolution of ε for films of PLLA of different thickness, whose value in nanometer
is labeled next to each curve. Reproduced from Martinez-Tong et al. [24] Copyright (2014) by the
American Physical Society
thinnest films. This system is thus optimal to fully test the validity of Eq. (4). Results
are shown in Fig. 10, where the crystallization time is plotted as a function of the
thickness.
For this system, we obtain a value of ξ = 2.7±0.2. For films of PET capped by
thin layers of polystyrene [59], the value of ξ could be varied between approx 6 and 2.
We remark that values of ξ > 1 are not experimentally observed when analyzing the
temperature dependence of crystallization. The exotic condition ξ > 1 is a peculiar
feature of spatial analysis, as the one proposed here as a function of the thickness.
Based on recent work [60, 61], this intriguing condition hints at the presence of
a gradient in tracer diffusivity (mass transport within the polymer matrix), with a
S. Napolitano
Fig. 8 Dielectric spectra for two PLLA thin films. (a) and (b) correspond to a film of thickness =
150 nm, amorphous and semicrystalline (t = 25 min) respectively. (c) and (d) correspond to a film
of thickness = 8 nm, amorphous first sweep and amorphous last sweep (t = 1600 min) respectively.
Reproduced from Martinez-Tong et al. [24] Copyright (2014) by the American Chemical Society
Fig. 9 Time evolution of ε for films of PLLA of different thickness, whose value in nanometer
is labeled next to each curve. Reproduced from Martinez-Tong et al. [24] Copyright (2014) by the
American Physical Society
thinnest films. This system is thus optimal to fully test the validity of Eq. (4). Results
are shown in Fig. 10, where the crystallization time is plotted as a function of the
thickness.
For this system, we obtain a value of ξ = 2.7±0.2. For films of PET capped by
thin layers of polystyrene [59], the value of ξ could be varied between approx 6 and 2.
We remark that values of ξ > 1 are not experimentally observed when analyzing the
temperature dependence of crystallization. The exotic condition ξ > 1 is a peculiar
feature of spatial analysis, as the one proposed here as a function of the thickness.
Based on recent work [60, 61], this intriguing condition hints at the presence of
a gradient in tracer diffusivity (mass transport within the polymer matrix), with a