

Order and Dielectric Relaxation During Polymer Crystallization
203
38]. The evolution of the crystallinity with crystallization time typically presents a
characteristic sigmoidal shape as shown in the bottom of the left panel of Fig. 5.
As time increases the main effect is that the dielectric strength (ε) of the initial αrelaxation decreases whereas the α
-relaxation grows up. In addition, crystallization
also affects the shape and frequency location of the α-relaxation. The b and c parameters decrease and increase, respectively, indicating broadening and symmetrization
of the α-relaxation. The broadening parameter has been associated to large scale
motions suggesting that these are dramatically affected by crystallization[39].
During crystallization not only segmental dynamics but also local dynamics,
giving rise to the dielectric β-relaxation, can be significantly affected. The βrelaxation, observed below and above T g , is a dielectric process faster than the α
one and therefore appearing in a BDS experiment at higher frequencies [40].
To measure the β-relaxation in real-time at crystallization temperatures of interest
is a difficult task since typically, as illustrated in Fig. 4, the maximum of the βrelaxation is located out of the frequency window covered by standard dielectric spectrometers. However some procedures can be used in order to achieve a quasi real-time
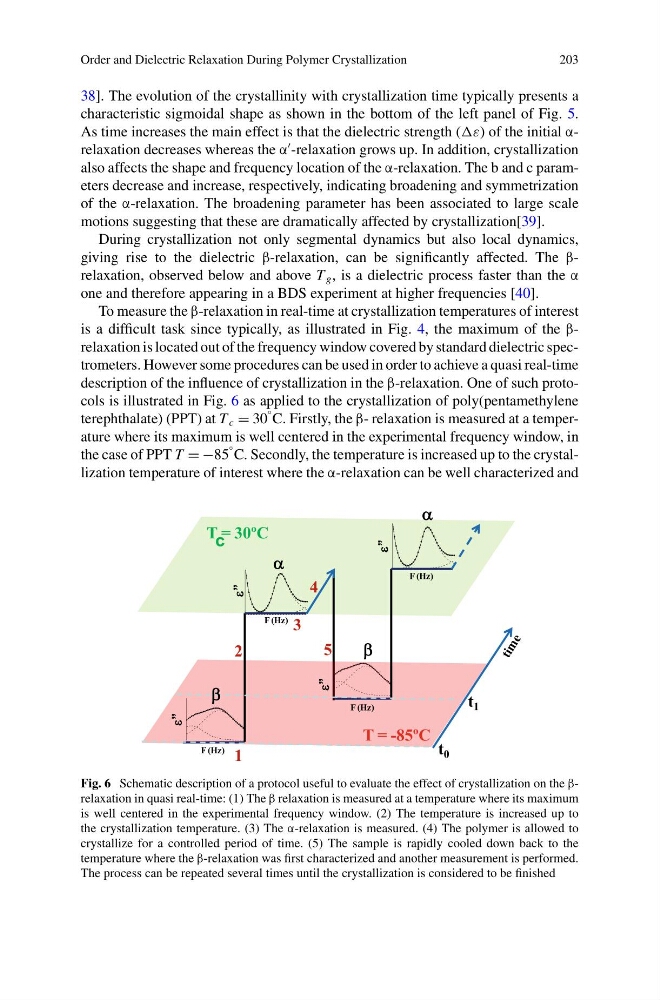
description of the influence of crystallization in the β-relaxation. One of such protocols is illustrated in Fig. 6 as applied to the crystallization of poly(pentamethylene
terephthalate) (PPT) at T c = 30
° C. Firstly, the β- relaxation is measured at a temperature where its maximum is well centered in the experimental frequency window, in
the case of PPT T = −85
° C. Secondly, the temperature is increased up to the crystallization temperature of interest where the α-relaxation can be well characterized and
Fig. 6 Schematic description of a protocol useful to evaluate the effect of crystallization on the βrelaxation in quasi real-time: (1) The β relaxation is measured at a temperature where its maximum
is well centered in the experimental frequency window. (2) The temperature is increased up to
the crystallization temperature. (3) The α-relaxation is measured. (4) The polymer is allowed to
crystallize for a controlled period of time. (5) The sample is rapidly cooled down back to the
temperature where the β-relaxation was first characterized and another measurement is performed.
The process can be repeated several times until the crystallization is considered to be finished
203
38]. The evolution of the crystallinity with crystallization time typically presents a
characteristic sigmoidal shape as shown in the bottom of the left panel of Fig. 5.
As time increases the main effect is that the dielectric strength (ε) of the initial αrelaxation decreases whereas the α
-relaxation grows up. In addition, crystallization
also affects the shape and frequency location of the α-relaxation. The b and c parameters decrease and increase, respectively, indicating broadening and symmetrization
of the α-relaxation. The broadening parameter has been associated to large scale
motions suggesting that these are dramatically affected by crystallization[39].
During crystallization not only segmental dynamics but also local dynamics,
giving rise to the dielectric β-relaxation, can be significantly affected. The βrelaxation, observed below and above T g , is a dielectric process faster than the α
one and therefore appearing in a BDS experiment at higher frequencies [40].
To measure the β-relaxation in real-time at crystallization temperatures of interest
is a difficult task since typically, as illustrated in Fig. 4, the maximum of the βrelaxation is located out of the frequency window covered by standard dielectric spectrometers. However some procedures can be used in order to achieve a quasi real-time
description of the influence of crystallization in the β-relaxation. One of such protocols is illustrated in Fig. 6 as applied to the crystallization of poly(pentamethylene
terephthalate) (PPT) at T c = 30
° C. Firstly, the β- relaxation is measured at a temperature where its maximum is well centered in the experimental frequency window, in
the case of PPT T = −85
° C. Secondly, the temperature is increased up to the crystallization temperature of interest where the α-relaxation can be well characterized and
Fig. 6 Schematic description of a protocol useful to evaluate the effect of crystallization on the βrelaxation in quasi real-time: (1) The β relaxation is measured at a temperature where its maximum
is well centered in the experimental frequency window. (2) The temperature is increased up to
the crystallization temperature. (3) The α-relaxation is measured. (4) The polymer is allowed to
crystallize for a controlled period of time. (5) The sample is rapidly cooled down back to the
temperature where the β-relaxation was first characterized and another measurement is performed.
The process can be repeated several times until the crystallization is considered to be finished