

Dynamics of Water in Partially Crystallized Solutions of Glass …
181
the dynamical alterations after crystallization. Even more, given that the isothermal
crystallization of water is slow at certain temperatures, it is possible to follow the
time evolution of the dielectric permittivity during crystallization.
To obtain a semi-crystalline sample, we selected a water content high enough to
observe cold crystallization on heating. Water is able to crystallize at any temperature
between the glass transition and the melting point (see Fig. 3c). This allows analyzing
the dynamics of both the amorphous and semi-crystalline state of the same sample.
In all the cases, the protocol is as follows:
1. We measure the dynamics of the amorphous sample up to a temperature where
cold crystallization is not detected.
2. Then, we allow the sample to crystallize isothermally at a temperature T cryst
during some time (t cryst ).
3. After crystallization, we measure the dynamics of the semi-crystalline sample.
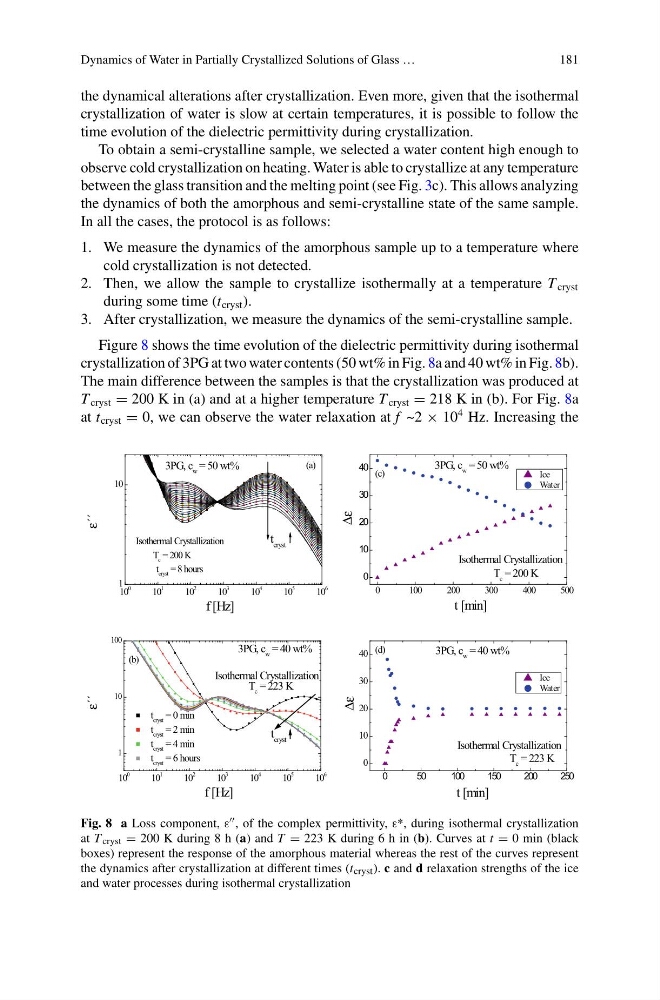
Figure 8 shows the time evolution of the dielectric permittivity during isothermal
crystallization of 3PG at two water contents (50 wt% in Fig. 8a and 40 wt% in Fig. 8b).
The main difference between the samples is that the crystallization was produced at
T cryst = 200 K in (a) and at a higher temperature T cryst = 218 K in (b). For Fig. 8a
at t cryst = 0, we can observe the water relaxation at f ~2 × 10
4 Hz. Increasing the
10
0
10
1
10
2
10
3
10
4
10
5
10
6
1
10
0
100
200
300
400
500
0
10
20
30
40
10
0
10
1
10
2
10
3
10
4
10
5
10
6
1
10
100
0
50
100
150
200
250
0
10
20
30
40
t cryst = 8 hours
t cryst
(a)
3PG, c w = 50 wt%
ε´´
f [Hz]
T c = 200 K
Isothermal Crystallization
(c)
Isothermal Crystallization
T c = 200 K
3PG, c w = 50 wt%
Δε
t [min]
Ice
Water
(b)
t cryst = 0 min
t cryst = 2 min
t cryst = 4 min
t cryst = 6 hours
3PG, c w = 40 wt%
ε´´
f [Hz]
T c = 223 K
Isothermal Crystallization
t cryst
(d)
T c = 223 K
Isothermal Crystallization
3PG, c w = 40 wt%
Δε
t [min]
Ice
Water
Fig. 8 a Loss component, ε , of the complex permittivity, ε*, during isothermal crystallization
at T cryst = 200 K during 8 h (a) and T = 223 K during 6 h in (b). Curves at t = 0 min (black
boxes) represent the response of the amorphous material whereas the rest of the curves represent
the dynamics after crystallization at different times (t cryst ). c and d relaxation strengths of the ice
and water processes during isothermal crystallization
181
the dynamical alterations after crystallization. Even more, given that the isothermal
crystallization of water is slow at certain temperatures, it is possible to follow the
time evolution of the dielectric permittivity during crystallization.
To obtain a semi-crystalline sample, we selected a water content high enough to
observe cold crystallization on heating. Water is able to crystallize at any temperature
between the glass transition and the melting point (see Fig. 3c). This allows analyzing
the dynamics of both the amorphous and semi-crystalline state of the same sample.
In all the cases, the protocol is as follows:
1. We measure the dynamics of the amorphous sample up to a temperature where
cold crystallization is not detected.
2. Then, we allow the sample to crystallize isothermally at a temperature T cryst
during some time (t cryst ).
3. After crystallization, we measure the dynamics of the semi-crystalline sample.
Figure 8 shows the time evolution of the dielectric permittivity during isothermal
crystallization of 3PG at two water contents (50 wt% in Fig. 8a and 40 wt% in Fig. 8b).
The main difference between the samples is that the crystallization was produced at
T cryst = 200 K in (a) and at a higher temperature T cryst = 218 K in (b). For Fig. 8a
at t cryst = 0, we can observe the water relaxation at f ~2 × 10
4 Hz. Increasing the
10
0
10
1
10
2
10
3
10
4
10
5
10
6
1
10
0
100
200
300
400
500
0
10
20
30
40
10
0
10
1
10
2
10
3
10
4
10
5
10
6
1
10
100
0
50
100
150
200
250
0
10
20
30
40
t cryst = 8 hours
t cryst
(a)
3PG, c w = 50 wt%
ε´´
f [Hz]
T c = 200 K
Isothermal Crystallization
(c)
Isothermal Crystallization
T c = 200 K
3PG, c w = 50 wt%
Δε
t [min]
Ice
Water
(b)
t cryst = 0 min
t cryst = 2 min
t cryst = 4 min
t cryst = 6 hours
3PG, c w = 40 wt%
ε´´
f [Hz]
T c = 223 K
Isothermal Crystallization
t cryst
(d)
T c = 223 K
Isothermal Crystallization
3PG, c w = 40 wt%
Δε
t [min]
Ice
Water
Fig. 8 a Loss component, ε , of the complex permittivity, ε*, during isothermal crystallization
at T cryst = 200 K during 8 h (a) and T = 223 K during 6 h in (b). Curves at t = 0 min (black
boxes) represent the response of the amorphous material whereas the rest of the curves represent
the dynamics after crystallization at different times (t cryst ). c and d relaxation strengths of the ice
and water processes during isothermal crystallization