

Control of Crystallization Pathways by Electric Fields
155
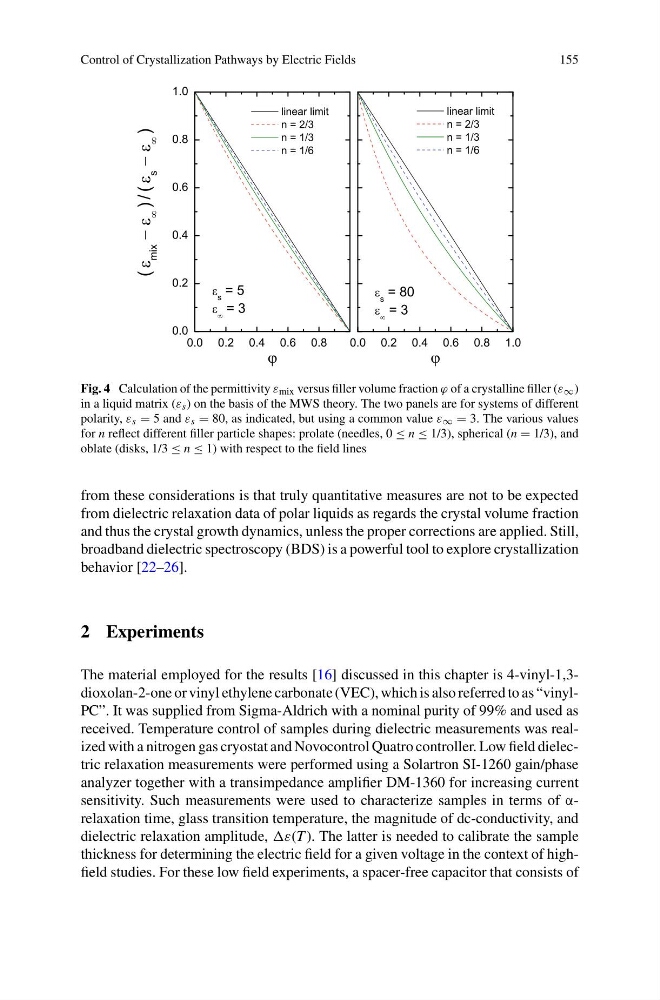
Fig. 4 Calculation of the permittivity ε mix versus filler volume fraction ϕ of a crystalline filler (ε ∞ )
in a liquid matrix (ε s ) on the basis of the MWS theory. The two panels are for systems of different
polarity, ε s = 5 and ε s = 80, as indicated, but using a common value ε ∞ = 3. The various values
for n reflect different filler particle shapes: prolate (needles, 0 ≤ n ≤ 1/3), spherical (n = 1/3), and
oblate (disks, 1/3 ≤ n ≤ 1) with respect to the field lines
from these considerations is that truly quantitative measures are not to be expected
from dielectric relaxation data of polar liquids as regards the crystal volume fraction
and thus the crystal growth dynamics, unless the proper corrections are applied. Still,
broadband dielectric spectroscopy (BDS) is a powerful tool to explore crystallization
behavior [22–26].
2 Experiments
The material employed for the results [16] discussed in this chapter is 4-vinyl-1,3dioxolan-2-one or vinyl ethylene carbonate (VEC), which is also referred to as “vinylPC”. It was supplied from Sigma-Aldrich with a nominal purity of 99% and used as
received. Temperature control of samples during dielectric measurements was realized with a nitrogen gas cryostat and Novocontrol Quatro controller. Low field dielectric relaxation measurements were performed using a Solartron SI-1260 gain/phase
analyzer together with a transimpedance amplifier DM-1360 for increasing current
sensitivity. Such measurements were used to characterize samples in terms of αrelaxation time, glass transition temperature, the magnitude of dc-conductivity, and
dielectric relaxation amplitude, ). The latter is needed to calibrate the sample
thickness for determining the electric field for a given voltage in the context of highfield studies. For these low field experiments, a spacer-free capacitor that consists of
155
Fig. 4 Calculation of the permittivity ε mix versus filler volume fraction ϕ of a crystalline filler (ε ∞ )
in a liquid matrix (ε s ) on the basis of the MWS theory. The two panels are for systems of different
polarity, ε s = 5 and ε s = 80, as indicated, but using a common value ε ∞ = 3. The various values
for n reflect different filler particle shapes: prolate (needles, 0 ≤ n ≤ 1/3), spherical (n = 1/3), and
oblate (disks, 1/3 ≤ n ≤ 1) with respect to the field lines
from these considerations is that truly quantitative measures are not to be expected
from dielectric relaxation data of polar liquids as regards the crystal volume fraction
and thus the crystal growth dynamics, unless the proper corrections are applied. Still,
broadband dielectric spectroscopy (BDS) is a powerful tool to explore crystallization
behavior [22–26].
2 Experiments
The material employed for the results [16] discussed in this chapter is 4-vinyl-1,3dioxolan-2-one or vinyl ethylene carbonate (VEC), which is also referred to as “vinylPC”. It was supplied from Sigma-Aldrich with a nominal purity of 99% and used as
received. Temperature control of samples during dielectric measurements was realized with a nitrogen gas cryostat and Novocontrol Quatro controller. Low field dielectric relaxation measurements were performed using a Solartron SI-1260 gain/phase
analyzer together with a transimpedance amplifier DM-1360 for increasing current
sensitivity. Such measurements were used to characterize samples in terms of αrelaxation time, glass transition temperature, the magnitude of dc-conductivity, and
dielectric relaxation amplitude, ). The latter is needed to calibrate the sample
thickness for determining the electric field for a given voltage in the context of highfield studies. For these low field experiments, a spacer-free capacitor that consists of