

1.5 New Class of Detecting Media for Holography—Gaseous Media …
37
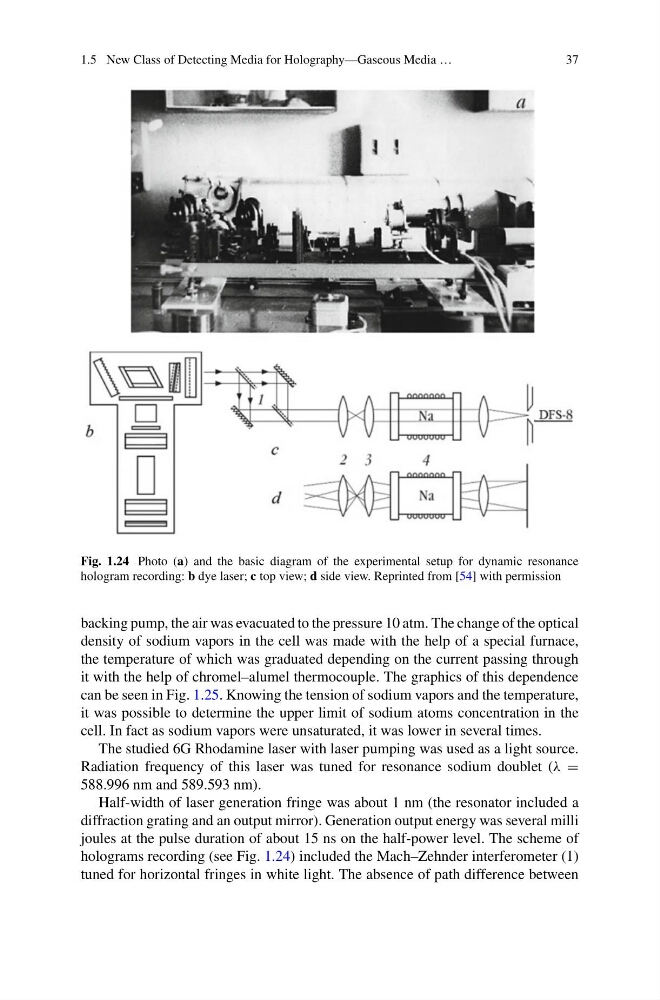
Fig. 1.24 Photo (a) and the basic diagram of the experimental setup for dynamic resonance
hologram recording: b dye laser; c top view; d side view. Reprinted from [54] with permission
backing pump, the air was evacuated to the pressure 10 atm. The change of the optical
density of sodium vapors in the cell was made with the help of a special furnace,
the temperature of which was graduated depending on the current passing through
it with the help of chromel–alumel thermocouple. The graphics of this dependence
can be seen in Fig. 1.25. Knowing the tension of sodium vapors and the temperature,
it was possible to determine the upper limit of sodium atoms concentration in the
cell. In fact as sodium vapors were unsaturated, it was lower in several times.
The studied 6G Rhodamine laser with laser pumping was used as a light source.
Radiation frequency of this laser was tuned for resonance sodium doublet (λ =
588.996 nm and 589.593 nm).
Half-width of laser generation fringe was about 1 nm (the resonator included a
diffraction grating and an output mirror). Generation output energy was several milli
joules at the pulse duration of about 15 ns on the half-power level. The scheme of
holograms recording (see Fig. 1.24) included the Mach–Zehnder interferometer (1)
tuned for horizontal fringes in white light. The absence of path difference between
37
Fig. 1.24 Photo (a) and the basic diagram of the experimental setup for dynamic resonance
hologram recording: b dye laser; c top view; d side view. Reprinted from [54] with permission
backing pump, the air was evacuated to the pressure 10 atm. The change of the optical
density of sodium vapors in the cell was made with the help of a special furnace,
the temperature of which was graduated depending on the current passing through
it with the help of chromel–alumel thermocouple. The graphics of this dependence
can be seen in Fig. 1.25. Knowing the tension of sodium vapors and the temperature,
it was possible to determine the upper limit of sodium atoms concentration in the
cell. In fact as sodium vapors were unsaturated, it was lower in several times.
The studied 6G Rhodamine laser with laser pumping was used as a light source.
Radiation frequency of this laser was tuned for resonance sodium doublet (λ =
588.996 nm and 589.593 nm).
Half-width of laser generation fringe was about 1 nm (the resonator included a
diffraction grating and an output mirror). Generation output energy was several milli
joules at the pulse duration of about 15 ns on the half-power level. The scheme of
holograms recording (see Fig. 1.24) included the Mach–Zehnder interferometer (1)
tuned for horizontal fringes in white light. The absence of path difference between