

5.7 Study of Intensity Fluctuation Spectra of Dynamic …
423
Fig. 5.34 Dependence of on
the applied load. Reprinted
from [87] with permission
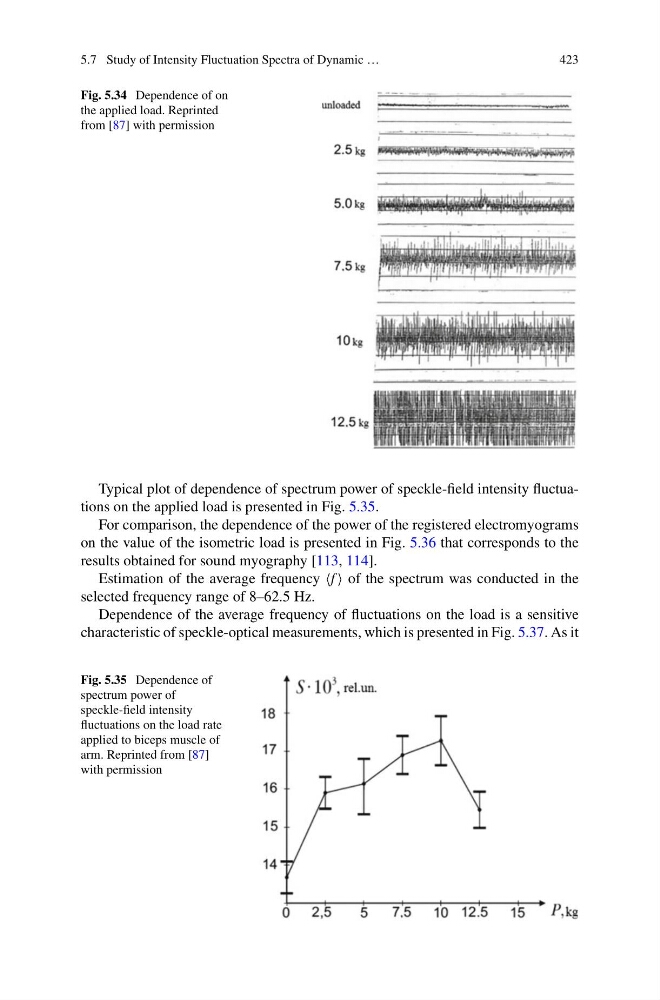
Typical plot of dependence of spectrum power of speckle-field intensity fluctuations on the applied load is presented in Fig. 5.35.
For comparison, the dependence of the power of the registered electromyograms
on the value of the isometric load is presented in Fig. 5.36 that corresponds to the
results obtained for sound myography [113, 114].
Estimation of the average frequency f of the spectrum was conducted in the
selected frequency range of 8–62.5 Hz.
Dependence of the average frequency of fluctuations on the load is a sensitive
characteristic of speckle-optical measurements, which is presented in Fig. 5.37. As it
Fig. 5.35 Dependence of
spectrum power of
speckle-field intensity
fluctuations on the load rate
applied to biceps muscle of
arm. Reprinted from [87]
with permission
423
Fig. 5.34 Dependence of on
the applied load. Reprinted
from [87] with permission
Typical plot of dependence of spectrum power of speckle-field intensity fluctuations on the applied load is presented in Fig. 5.35.
For comparison, the dependence of the power of the registered electromyograms
on the value of the isometric load is presented in Fig. 5.36 that corresponds to the
results obtained for sound myography [113, 114].
Estimation of the average frequency f of the spectrum was conducted in the
selected frequency range of 8–62.5 Hz.
Dependence of the average frequency of fluctuations on the load is a sensitive
characteristic of speckle-optical measurements, which is presented in Fig. 5.37. As it
Fig. 5.35 Dependence of
spectrum power of
speckle-field intensity
fluctuations on the load rate
applied to biceps muscle of
arm. Reprinted from [87]
with permission